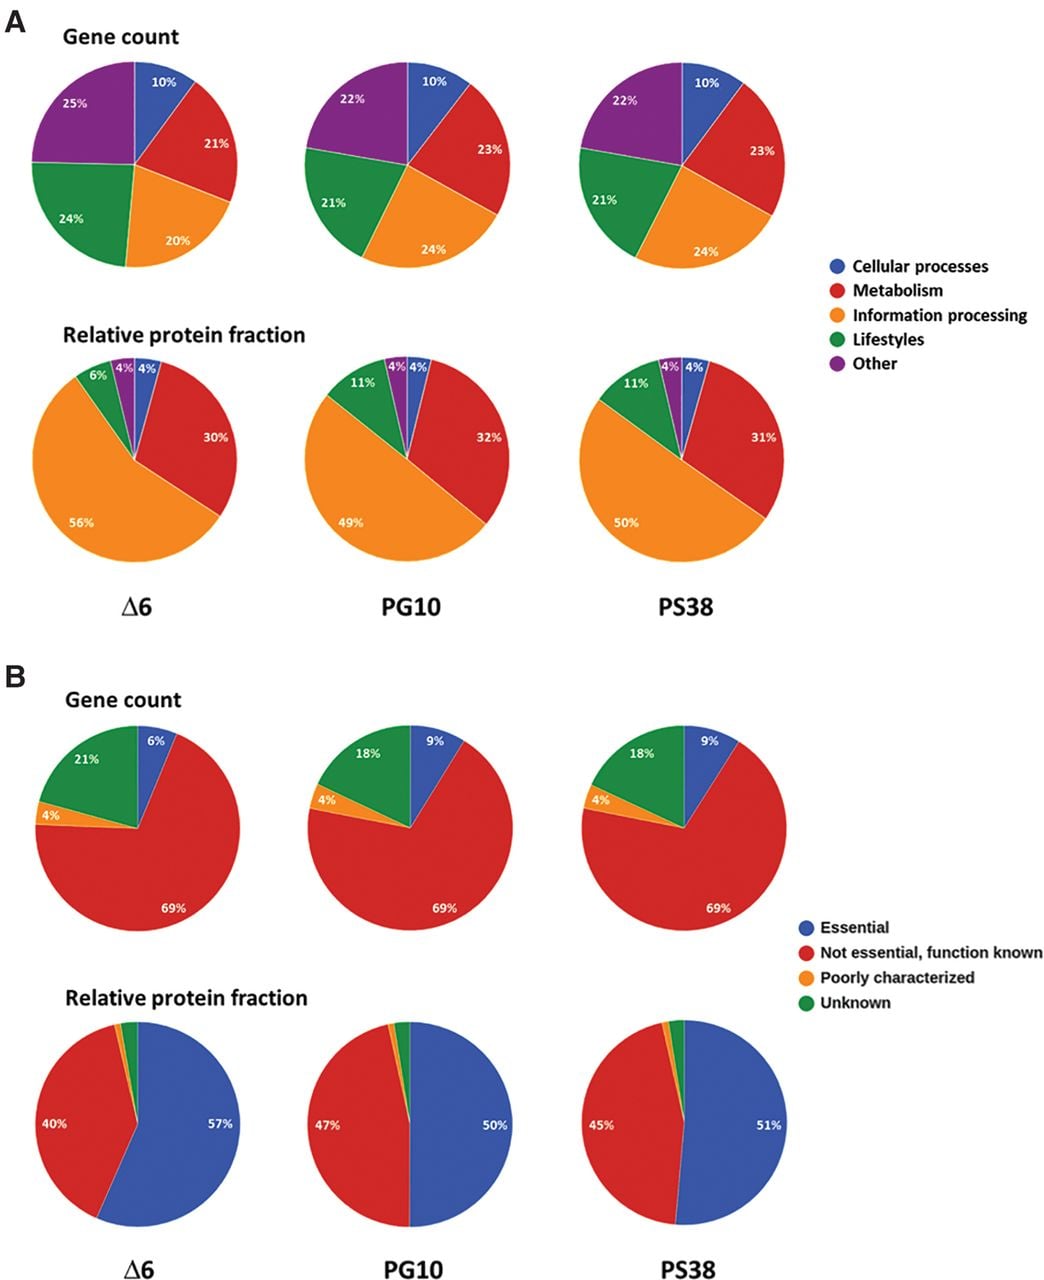
The functional distribution of the genes and their corresponding relative protein fractions are highly disproportional. (A) Gene distribution and allocation of translation capacity according to functional categories. The upper panel shows the functional distribution of genes in the genome-reduced strains. All genes were assigned to one of four major functional categories (cellular processes, metabolism, information processing, lifestyles). The lower panel shows the allocation of translation capacity to functional categories. (B) Extreme overrepresentation and underrepresentation of essential and unknown proteins, respectively, in the proteome. The upper panel shows the distribution of genes in the genome-reduced strains according to essentiality and the level of knowledge. All genes were assigned to one of four classes (essential; nonessential, function known; nonessential, poorly characterized; and nonessential, unknown). The lower panel shows the allocation of translation capacity according to essentiality and the level of knowledge. The alpha values (percentage abundance) obtained for the individual proteins in the proteome analyses were pooled for each class. The relative protein fractions indicate the allocation of translation resources to each class.