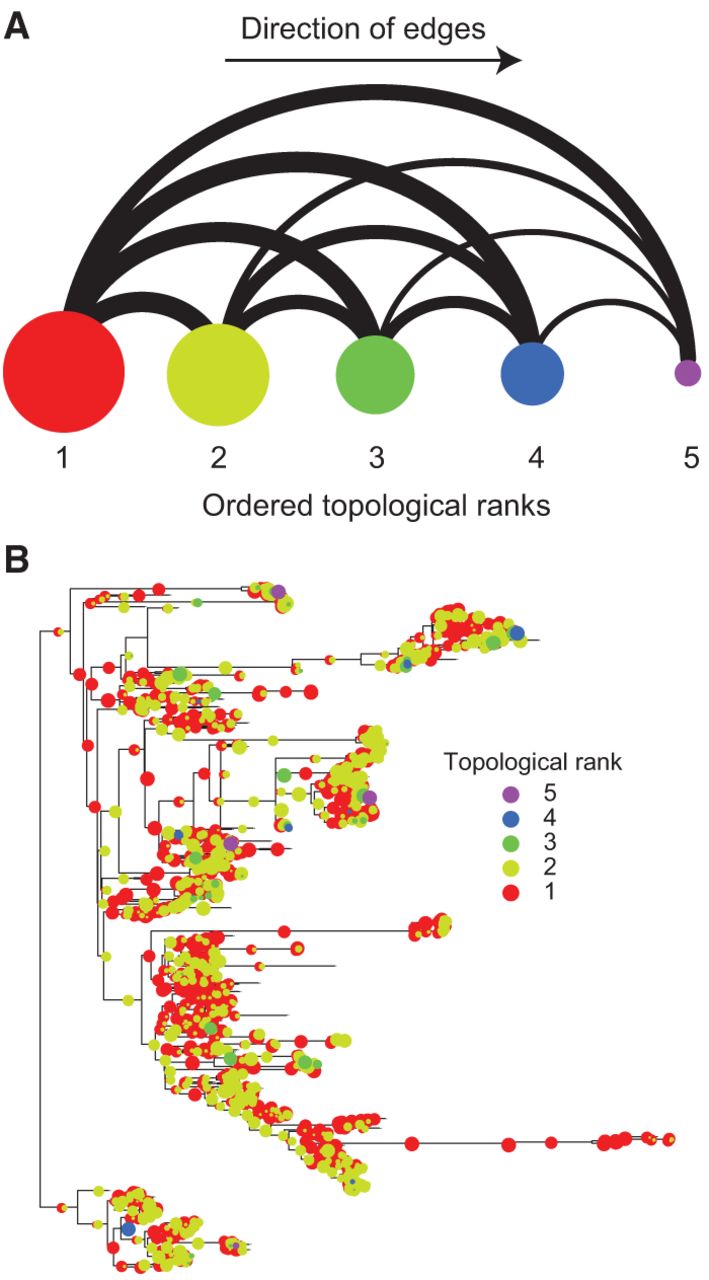
Topological sorting of the PGCE dependency network reveals assembly patterns that govern the evolutionary process. (A) Binned dependencies among the five ranks of genes in the topological sort (left to right). Node size represents the number of genes in each ranks (using natural logarithm scale). Edge width represents the number of PGCEs between genes in different ranks (natural logarithm scale); all edges are directed to the right. (B) The gain of genes from each rank in each branch of the phylogenetic tree is illustrated (circles). The different colors represent different ranks. Circle sizes correspond to the proportion of gains on a branch attributed to genes of that rank (e.g., a large red circle indicates that most gains on a branch correspond to rank 1). The branch to Archaea (bottommost clade) has been reduced in size for graphical purposes. See also Supplemental Figure S7.