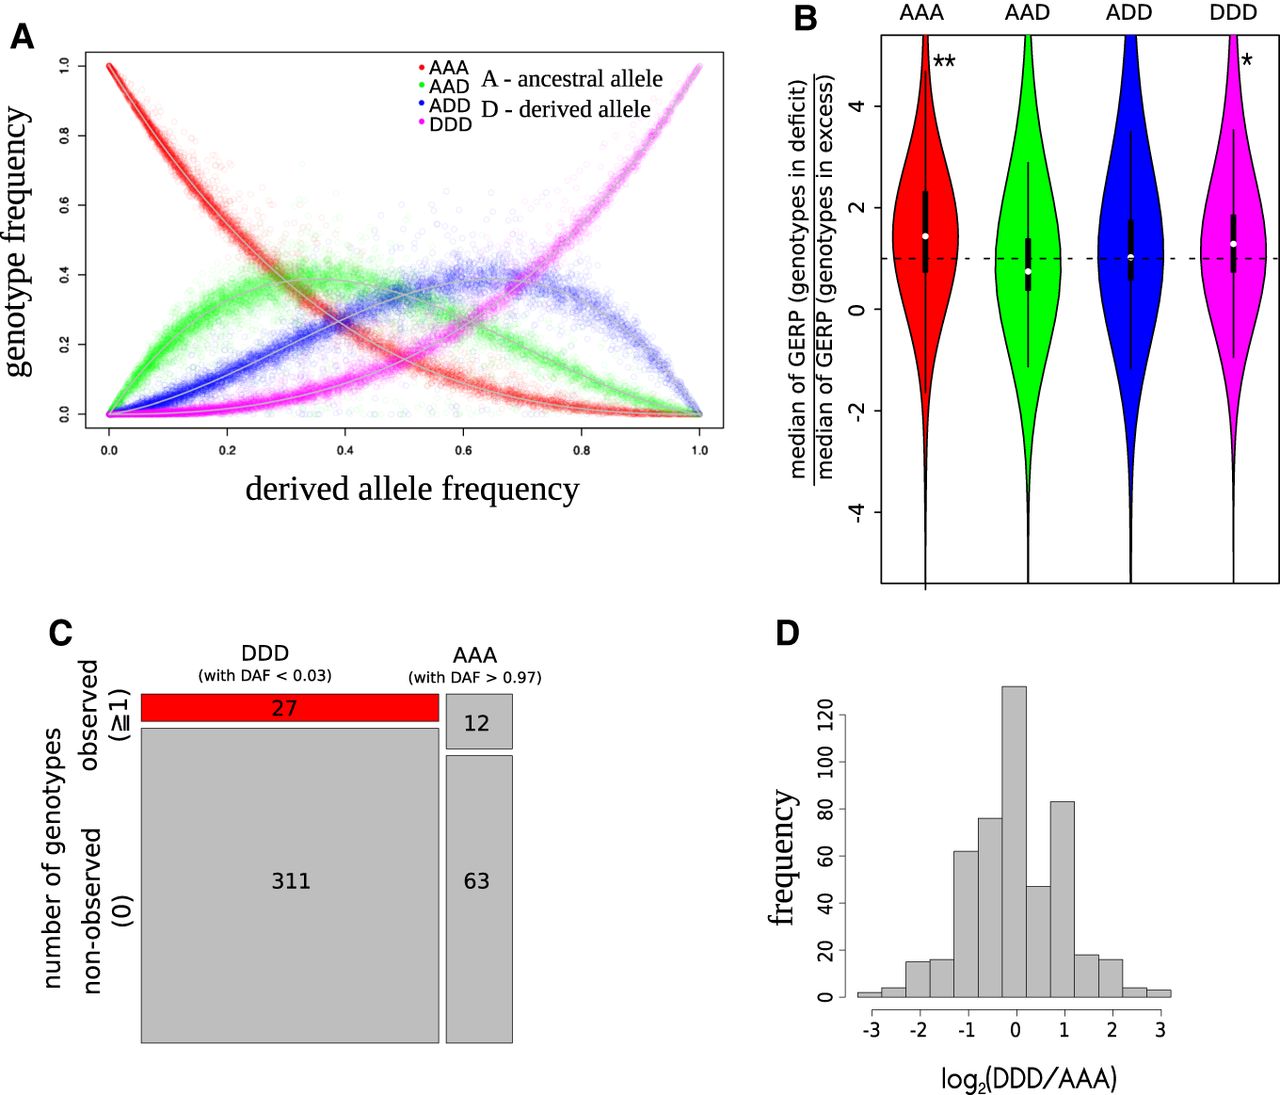
Hardy–Weinberg distribution of Chromosome 21 alleles and signatures of selection in the live-born T21 cohort. (A) Hardy–Weinberg distribution for trisomic alleles. The four curves represent the expected relationships between allele frequencies and genotype frequencies, assuming that the fraction of T21 individuals coming from nondisjunction in meiosis I is 74%. All dots are empirical observations. (B) The deficit of homozygous genotypes AAA and DDD is associated with increased evolutionary constraints of the corresponding nucleotide positions. Taking into account the genotypes in deficit and in excess (deviating by >5% from the expectation), we analyzed the GERP scores of the corresponding nucleotide positions. For each percentile of the derived allele frequency, we obtained the ratio of the median GERP scores for nucleotides associated with a deficit or an excess of genotypes. Violin plots reflect the distribution of these ratios for each genotype. In the case of AAA and DDD, the distribution of ratios has medians higher than the expected one: (*) P-value < 0.05; (**) P-value < 0.01. (C) Homozygotes for rare derived alleles (DDD) are rarer than the homozygotes for rare ancestral alleles (AAA) with the similar allele frequency: analysis of the two opposite tails of the Hardy–Weinberg distribution. (D) Observed homozygotes for rare derived alleles (DDD) are rarer than the observed homozygotes for rare ancestral alleles (AAA) with the same allele frequency: analysis of the 500 allele pairs, matched by allele frequency and characterized by the nonzero number of the observed homozygous genotypes. The distribution of the log2(DDD/AAA) has the median (−0.193) which is lower than the expected zero.