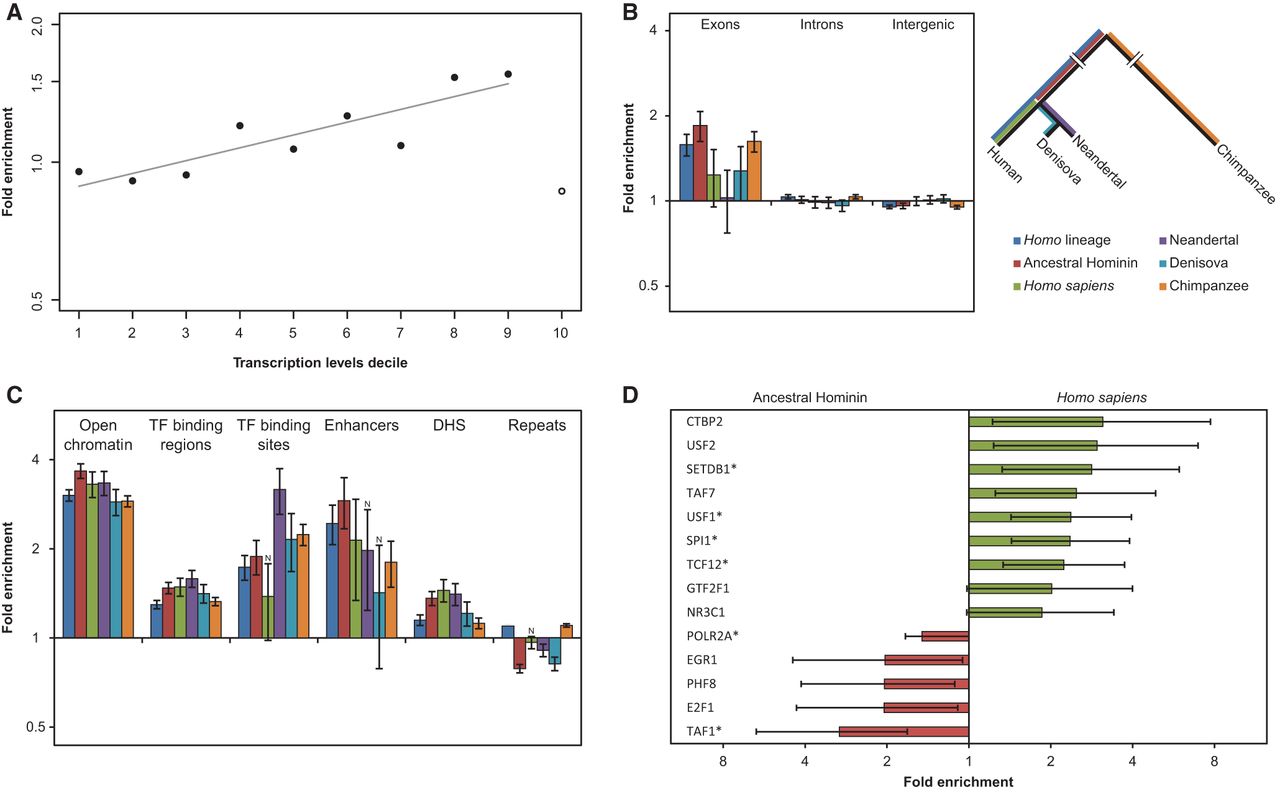
APOBEC3G mutations are associated with transcription and overrepresented in exons and regulatory regions. (A) The fold enrichment of the CCC motif in the first nine deciles (solid circles) of the A3G set relative to other mutations is strongly and positively correlated with expression levels (Pearson's correlation coefficient r = 0.87, P = 0.0012). Notably, the top decile (open circle) behaves differently in terms of fold-change and mutation counts. This can be expected from the increased evolutionary conservation of the most highly transcribed regions, which tend to show a lower tolerance to mutations, let alone clusters of mutations. (B) We distinguished between inter-genic regions, introns, and exons. An overrepresentation of A3G mutations within exons relative to the proportion of non-A3G mutations was found in most lineages (q < 0.05 for all regions that were tested in Homo and Pan and both, exons and inter-genic regions in modern and archaic humans. Two-tailed Fisher's exact test with Bonferroni correction). Error bars represent the standard errors that were calculated using a block bootstrap approach. (C) Regulatory regions are highly enriched in A3G mutations. Several transcriptional regulatory regions were inspected: open chromatin, transcription factor binding regions and binding sites, enhancers, and DNase I hypersensitive sites. All regions were found to be enriched in most of the lineages (q ≤ 0.05, two-tailed Fisher's exact test after Bonferroni correction; N indicates nonsignificance). Error bars represent the standard errors that were calculated using a block bootstrap approach. (D) The binding regions of various transcription factors were tested, and several of them showed differential A3G-related mutagenic activity before and after the split of archaic and modern humans. Red bars indicate enrichment before the split, while green bars mark enrichment in the derived lineages after the split. Only results with P < 0.05 (two-tailed Fisher's exact test) are shown. (*) FDR-adjusted P-value < 0.05. Error bars represent two-sided 95% confidence intervals for the exact test.