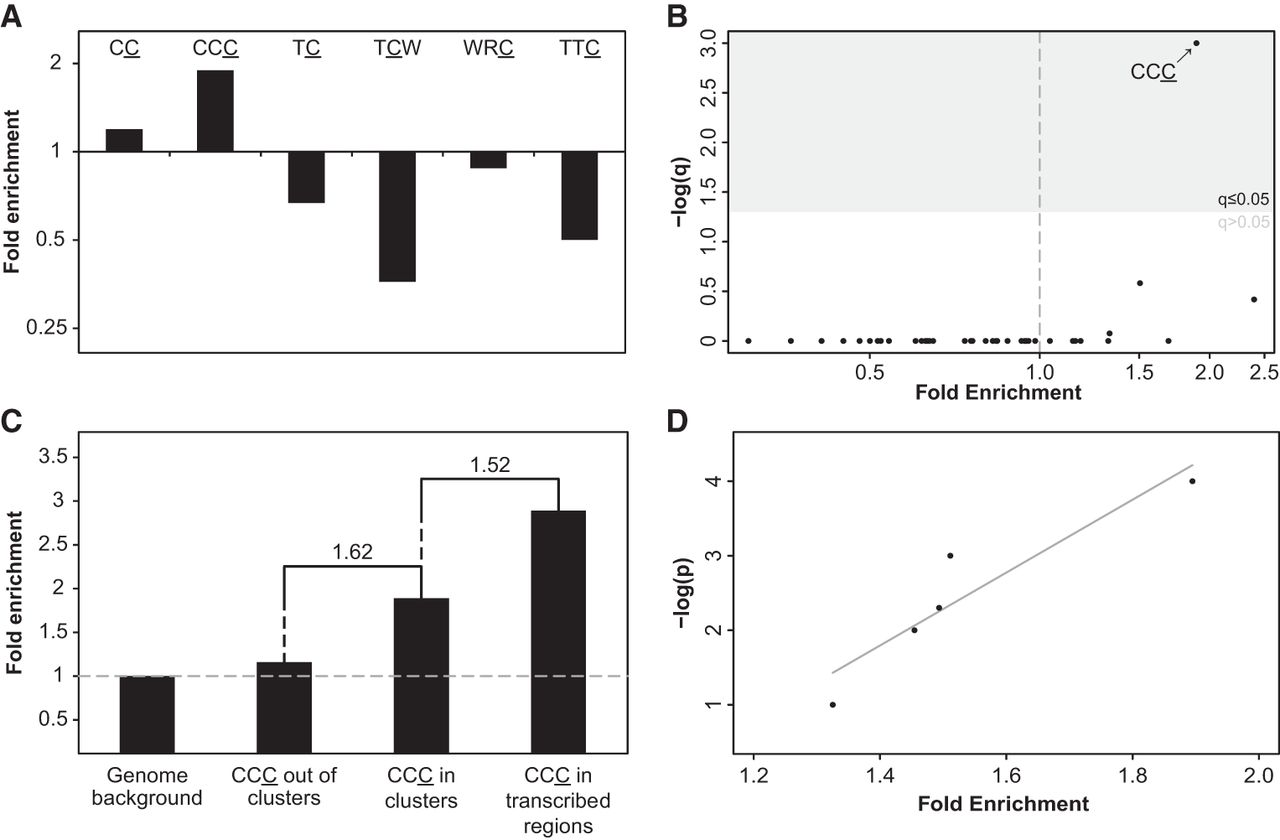
Identification of APOBEC3G mutagenesis pattern in human evolution. (A) A3G CC and CCC motifs are significantly enriched within the set of C- (or G-) coordinated clusters with cluster P-value ≤0.0001 (q < 0.006, one-tailed Fisher's exact test after Bonferroni correction. P-values were calculated by comparing the frequency of mutations within and outside a given motif while controlling for the frequency of C or G nucleotides within and outside this motif in the genome). Clusters are not enriched with any other APOBEC-related motif. (B) CCC, the A3G stringent motif, is the only CpG-free trinucleotide motif that is significantly enriched in C- (or G-) clusters (Bonferroni-corrected q-values were calculated as in A). (C) As expected from the known mechanism of A3G, mutations found in C- (or G-) coordinated clusters demonstrated higher enrichment relative to nonclustered events (one-tailed Fisher's exact test P = 1.35 × 10⁻⁸). Clustered mutations found in transcribed regions, which have a higher tendency to form ssDNA, exhibit higher enrichment levels compared with all clustered C (or G) mutations (one-tailed Fisher's exact test P = 0.045). Fold-change value between different bars is indicated above them. (D) A strong positive correlation (Pearson's r = 0.93, P < 0.05) is observed between the level of CCC motif enrichment and the significance threshold used to filter cluster sets (−log[P-value]).