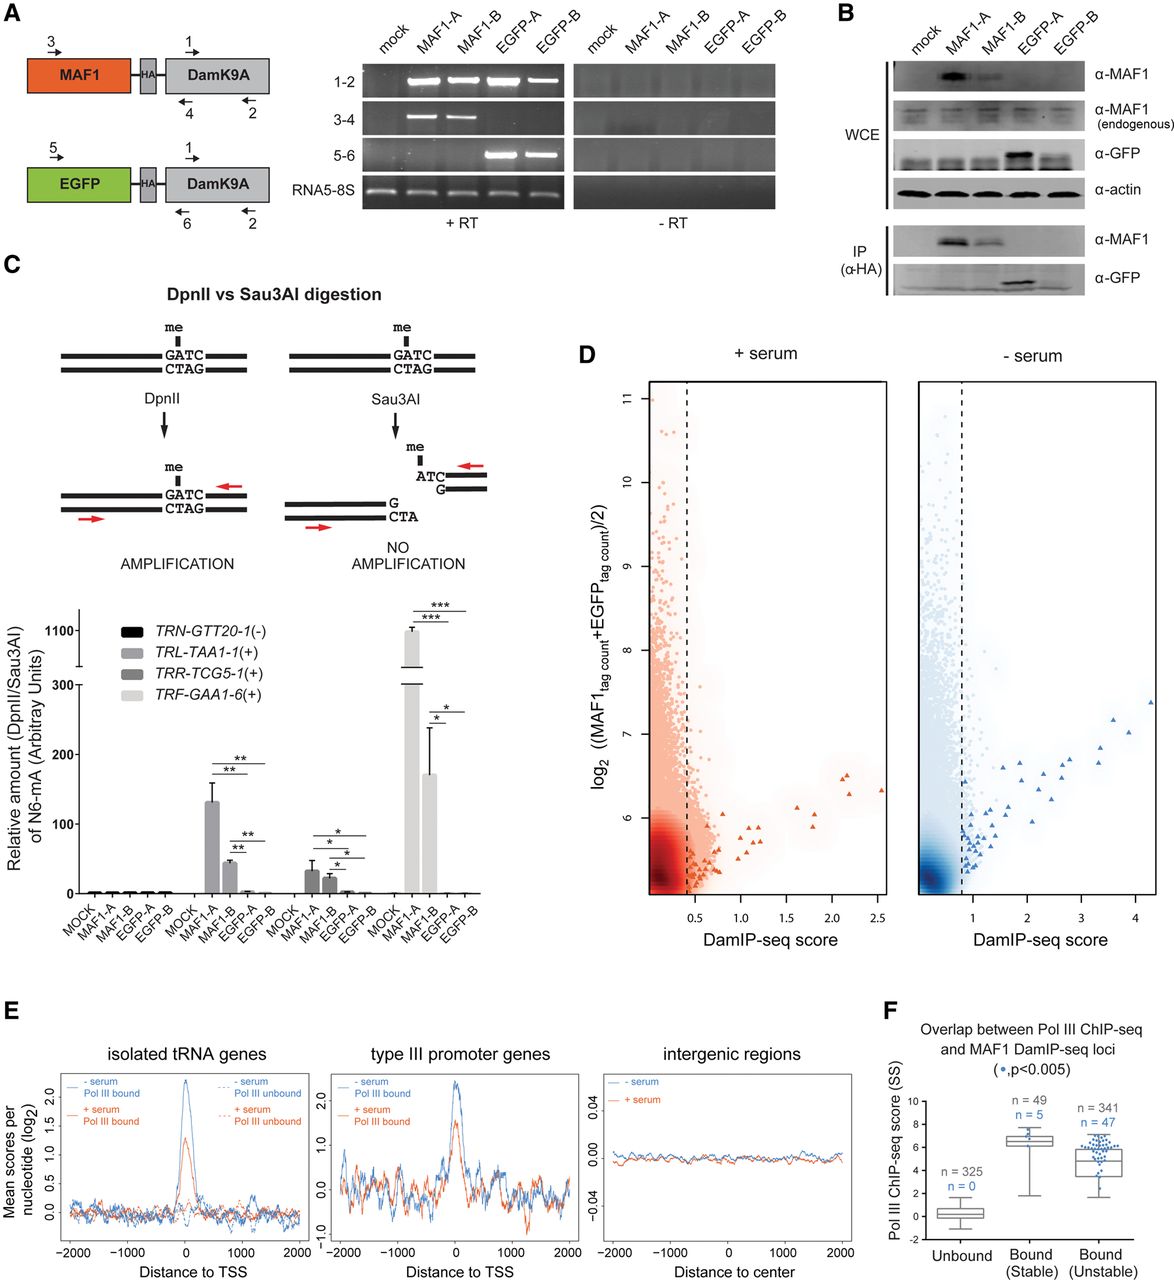
DamIP-seq shows MAF1 recruitment at Pol III–bound genes. (A) Schematic representation of MAF1-DamK9A and EGFP-DamK9A chimeric constructs depicting the position of PCR primers. Two stable IMR90hTert clonal cell lines expressing each chimera (MAF1-A, MAF1-B and EGFP-A, EGFP-B) were generated, and mRNA expression was validated via RT-PCR. The left and right blot panels show reactions containing (+RT) or not containing (−RT) reverse transcriptase. (B) Western blotting of whole-cell extracts or α-HA immunoprecipitates from the cell lines described in A. (C) Genomic DNA from MAF1-DamK9A–expressing and EGFP-DamK9A–expressing IMR90hTert cell lines was extracted after 8 h of serum starvation, digested with either DpnII or Sau3A, and analyzed by qPCR with tDNA-specific primers (upper panel). The qPCR signal (lower panel) was normalized against an intergenic region on Chr21 and is shown as DpnII versus Sau3A ratio in arbitrary units (A.U.). Data are mean ± SD (n = 3). (*) P < 0.05; (**) P < 0.01; (***) P < 0.001 (as calculated by Student's t-test). PCR primers and tDNA HUGO nomenclature are indicated in Supplemental Table S4. (D) Score versus average plots showing MAF1 association within 400-bp bins across the genome. The DamIP-seq score, defined as the log2 (MAF1tag count/EGFPtag count), is plotted on the x-axis, and the log2 of the mean MAF1 and EGFP DamIP-seq normalized tag counts is plotted on the y-axis, in each case for nonoverlapping 400-bp bins across the genome. The dotted line indicates the cutoff, set at the lowest score giving an FDR < 0.005. Pol III loci–containing bins are represented as red or blue triangles. (E) Meta-sample profiles depicting sequence coverage in a ±2-kb window surrounding the annotated 5′-ends of isolated (i.e., separated from each other by at least 2 kb) tRNA genes, type III promoter genes, and gene-free regions. MAF1 DamIP-seq scores per nucleotide are normalized for total tag count and calculated as the log2 (MAF1/EGFP). Signal for the +serum and −serum experiments is indicated in orange and blue, respectively. In the left panel, the dotted lines show Pol III–unbound tDNAs; the solid lines, Pol III–bound tDNAs. (F) Overlap between MAF1 (blue dots) and Pol III associated loci (boxes) in serum-starved IMR90hTert cells. Genes are ranked by Pol III SS ChIP-seq scores and split into Pol III unbound, bound-stable, and bound-unstable classes according to FBS versus SS ChIP-seq fold-change (Fig. 1C, blue). Only genes having at least one ATC within the gene body are considered.