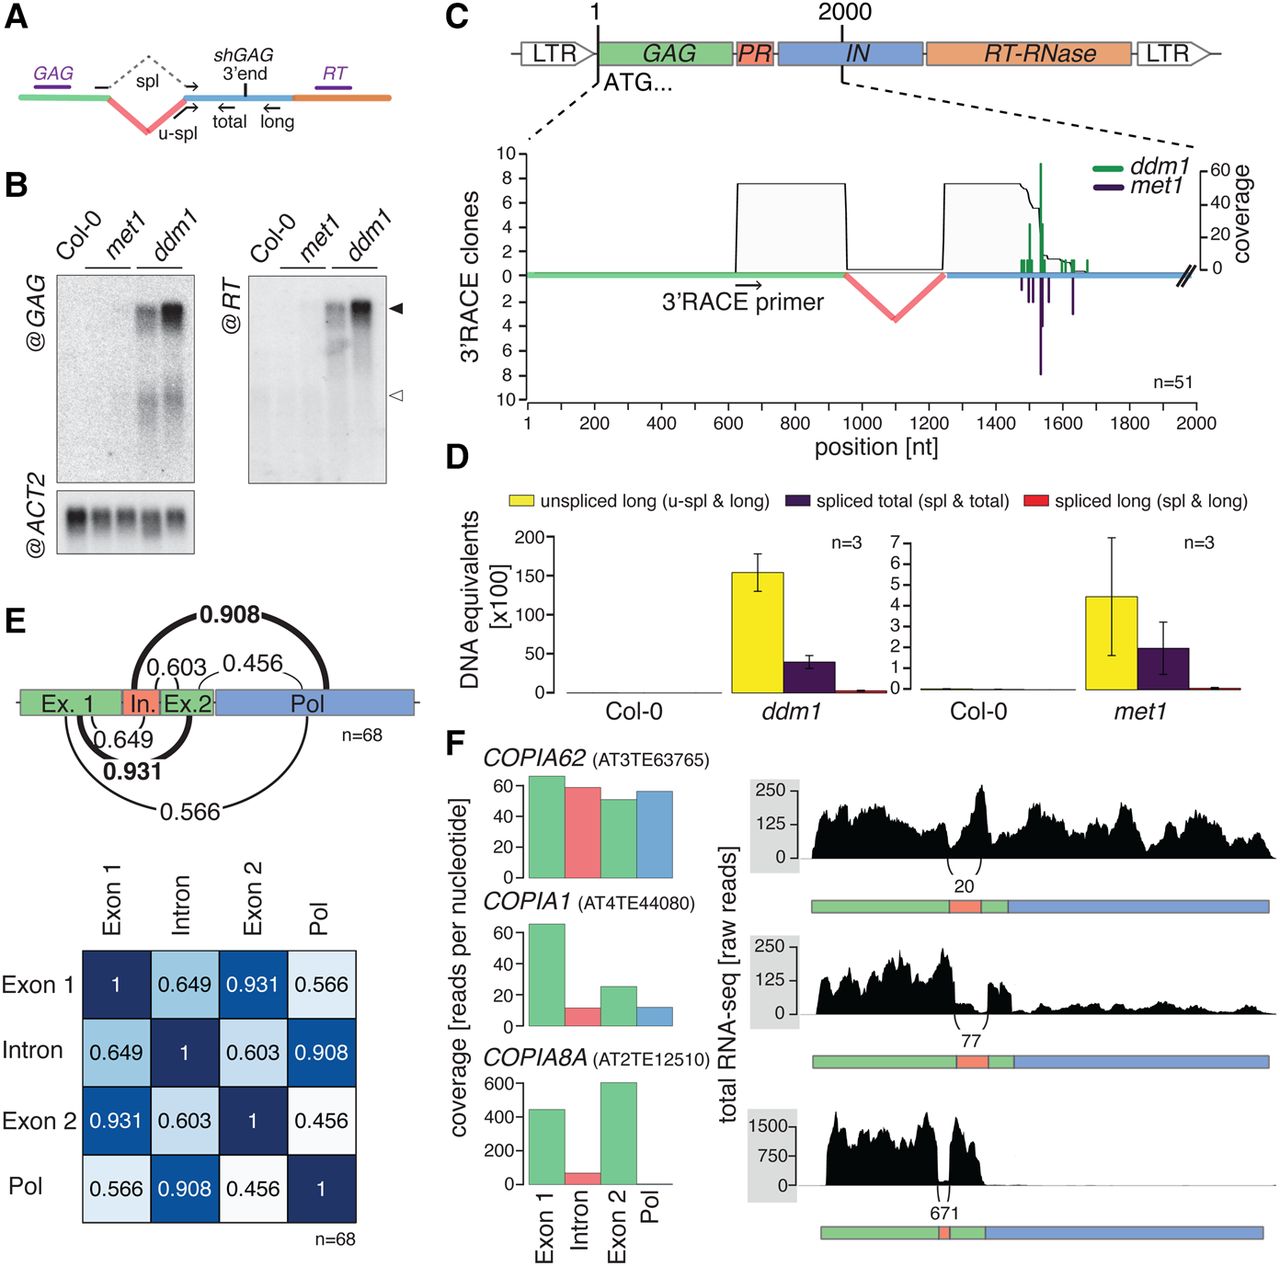
The shGAG subgenomic mRNA of EVD is prematurely terminated. (A) Scheme representing RNA blot probes (purple) and spliced (spl) and unspliced (u-spl) specific primers (black arrows) used for qPCR analysis of transcripts from epigenetically reactivated EVD. (B) Northern blot analysis of EVD-derived transcripts in wild-type (Col-0), met1, and ddm1 plants. The full-length GAG-POL mRNA is indicated with a filled arrow; shGAG mRNA, with an empty arrow. (C) 3′ RACE analysis of the EVD shGAG mRNA. Green and blue bars represent 3′ ends cloned in ddm1 and met1 backgrounds, respectively. The gray area shows cumulative sequence coverage in both backgrounds. Positions are indicated in nucleotides (nt) from the EVD start codon. (n) number individual 3′ RACE clones sequenced. (D) Absolute qPCR quantification of spliced (spl) versus unspliced (u-spl) EVD transcripts from ddm1 and met1 plants versus Col-0. Error bars, SE of three biological replicates. (E) Pearson correlations of per-nucleotide coverage from total RNA-seq of the four bins (Exon 1, Intron, Exon 2, and POL) generated from novel intron annotations and extrapolation of the novel EVD termination site, as determined in C. (F) Examples of Ty1/Copia elements illustrating increasing splicing efficacies and corresponding intron versus POL expression ratios.