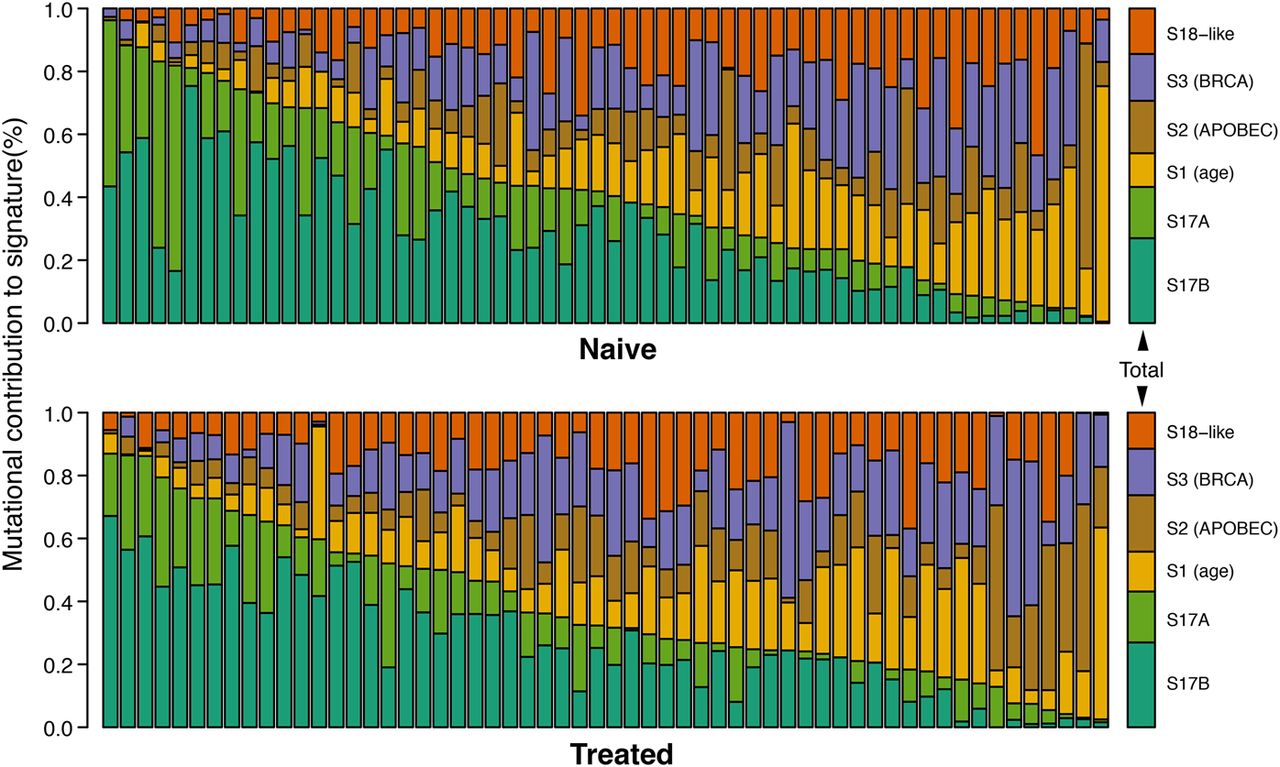
Figure 6.
Mutational spectra analysis in chemotherapy-treated and chemotherapy-naive patient groups. The most relevant signatures for each group have been identified according to the method published by Alexandrov et al. (2013). Each bar shows the proportion of calls for the relevant signature per sample; the bars on the far right, the cumulative proportion for each group.