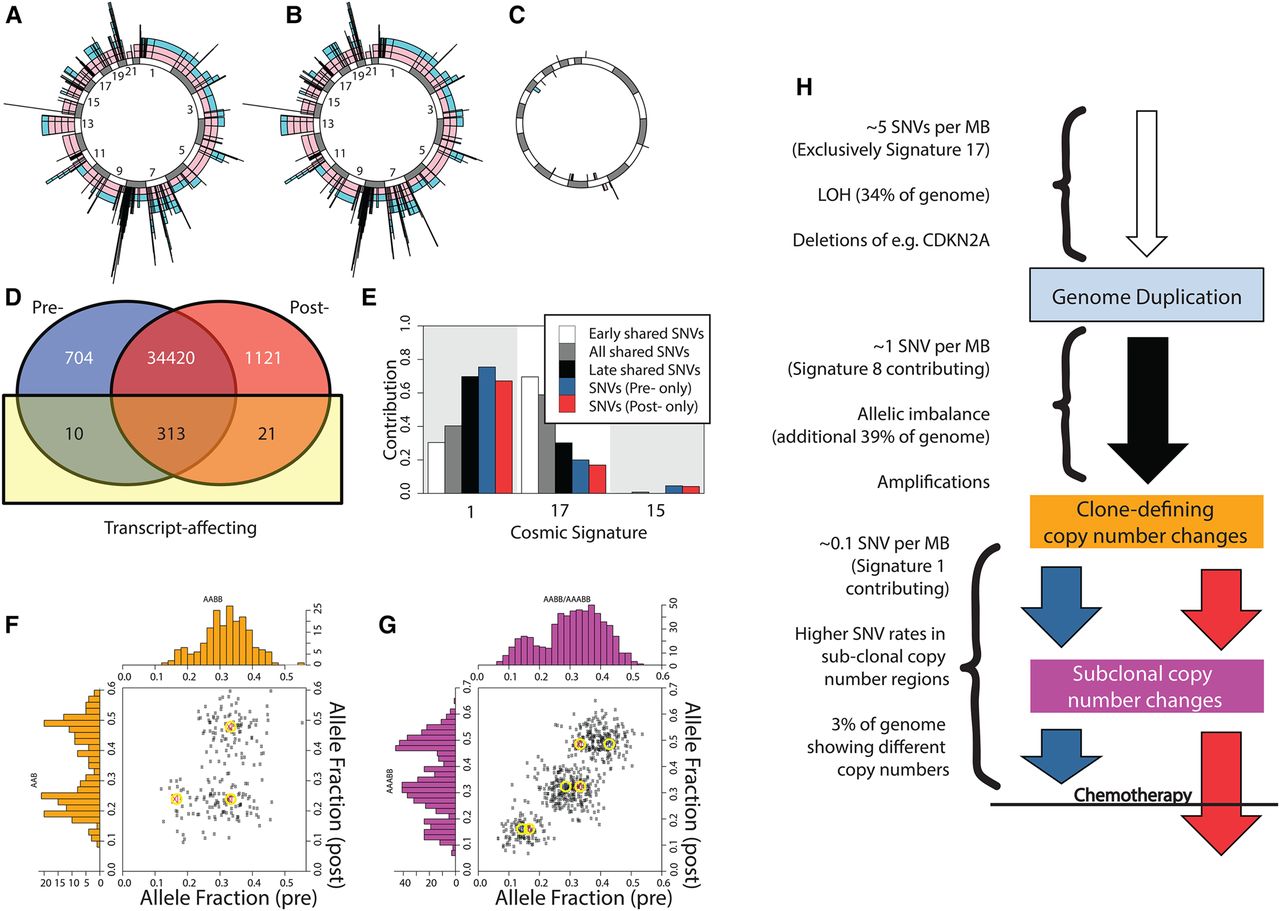
Profiling case 001 where the pre- and post-chemotherapy samples are similar. (A) Illustrated are allele-specific copy-number states for the 22 autosomes prechemotherapy (alleles represented by colors). (B) Illustrated are allele-specific copy-number states for the 22 autosomes post-chemotherapy. (C) Illustrating the difference between the two allele-specific copy-number profiles. Copy-number increases post- to prechemotherapy are shown outside the circle; decreases are shown inside the circle. (D) Venn diagram showing the numbers of SNV calls shared pre- and post-chemotherapy, classified also by whether they are transcript-affecting. (E) The mutational process signatures (reported at the Catalogue of Somatic Mutations in Cancer) that contribute substantially to the called SNVs are shown. Of the shared SNVs, approximately 14,000 lie within copy-number states AA, AAB, AABB, AAAA, or AAAAB and can confidently be categorized as early or late (relative to their copy-number changes). The contributions for these subsets are shown also. (F) Illustrating SNVs for a region that exhibits different copy-number states pre- (AABB) and post- (AAB) chemotherapy. The centers of predicted clusters for these states are indicated. Within each sample, the copy-number state appears to be consistent in 100% of tumor cells. (G) Illustrated are SNVs for a region that demonstrates subclonal copy-number behavior prechemotherapy. The two sets of expected cluster centers for clonal AABB (red) and AAABB (blue) solutions prechemotherapy, against AAABB post-chemotherapy, are illustrated. The lack of a fourth SNV cluster is a strong indicator that this is a subclonal loss of one copy from a previously clonal AAABB state. (H) A sketched likely timeline for this sample, although the timing of losses is supposition.