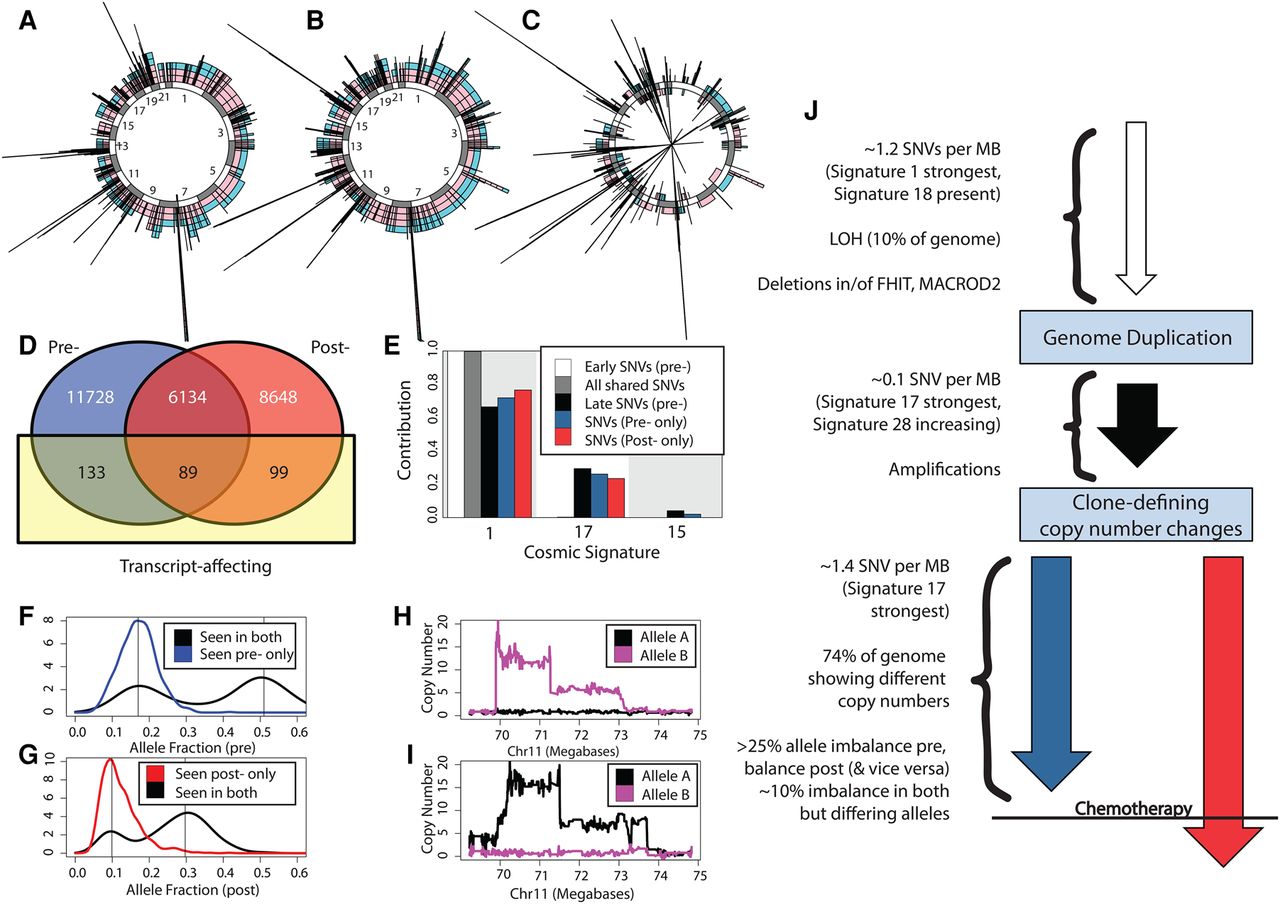
Profiling case 008 where the pre- and post-chemotherapy samples are different. (A–C) Illustrated are allele-specific copy-number states for the 22 autosomes: (A) prechemotherapy (alleles represented by colors), (B) post-chemotherapy, and (C) the difference between the two allele-specific copy-number profiles pre- and post-chemotherapy. Copy-number increases post- to prechemotherapy are shown outside the circle; decreases are shown inside the circle. (D) Venn diagram showing the numbers of SNV calls shared pre- and post-chemotherapy, classified also by whether they affect coding genes. (E) The mutational process signatures (reported in the Catalogue of Somatic Mutations in Cancer) that contribute substantially to the called SNVs are shown. Of the shared SNVs, approximately 6000 lie within copy-number states AA, AAB, AABB, AAA, or AAAA and can confidently be categorized as early or late (relative to their copy-number changes). The contributions for these subsets are shown also. (F) For regions that in the prechemotherapy sample have copy-number status AAA, we see that no SNVs unique to this sample have three copies. (G) For regions that in the post-chemotherapy sample have copy-number status AAA, we see that no SNVs unique to this sample that have three copies. (H) Illustrated are allele-specific copy numbers for a region of Chromosome 11 in the prechemotherapy sample. (I) Illustrated are allele-specific copy numbers for a region of Chromosome 11 in the post-chemotherapy sample. (J) A sketched likely timeline for this sample, although inherent to this type of data, the timings of losses are supposition.