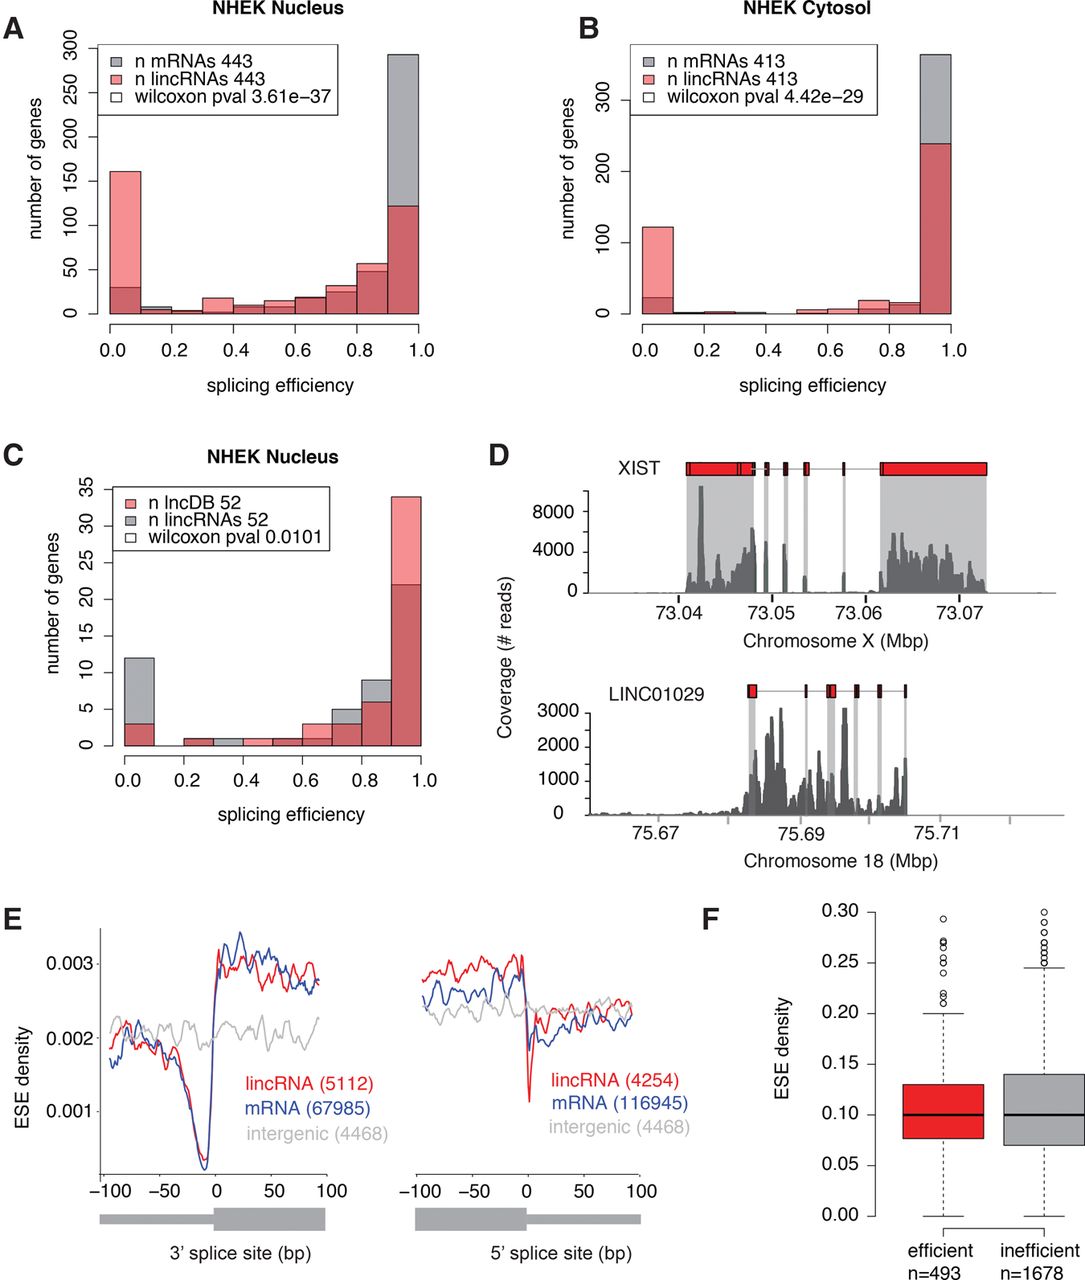
LincRNAs are less efficiently spliced than mRNAs. (A,B) Splicing efficiency in lincRNAs (>0.1 FPKM) and expression-matched mRNAs in the nuclear fraction (A) and cytosolic fraction (B) of human NHEK cells. (C) Splicing efficiency in functionally characterized (present in lncRNAdb) lincRNAs and expression-matched (>0.1 FPKM) uncharacterized lincRNAs. (D) RNA-seq read coverage for a representative functional, efficiently spliced lincRNA, XIST (top), and an uncharacterized, inefficiently spliced lincRNA, LINC01029 (bottom), in K562 cells. (E) Mean exonic splicing enhancer (ESE) density per bp in lincRNA and mRNA 3′ (left) and 5′ (right) splice sites, for all annotated exons larger than 200 bp, compared to random intergenic regions of the same length. (F) Distribution of ESE density per gene in efficiently (>0.5) and inefficiently spliced (<0.5) lincRNAs.