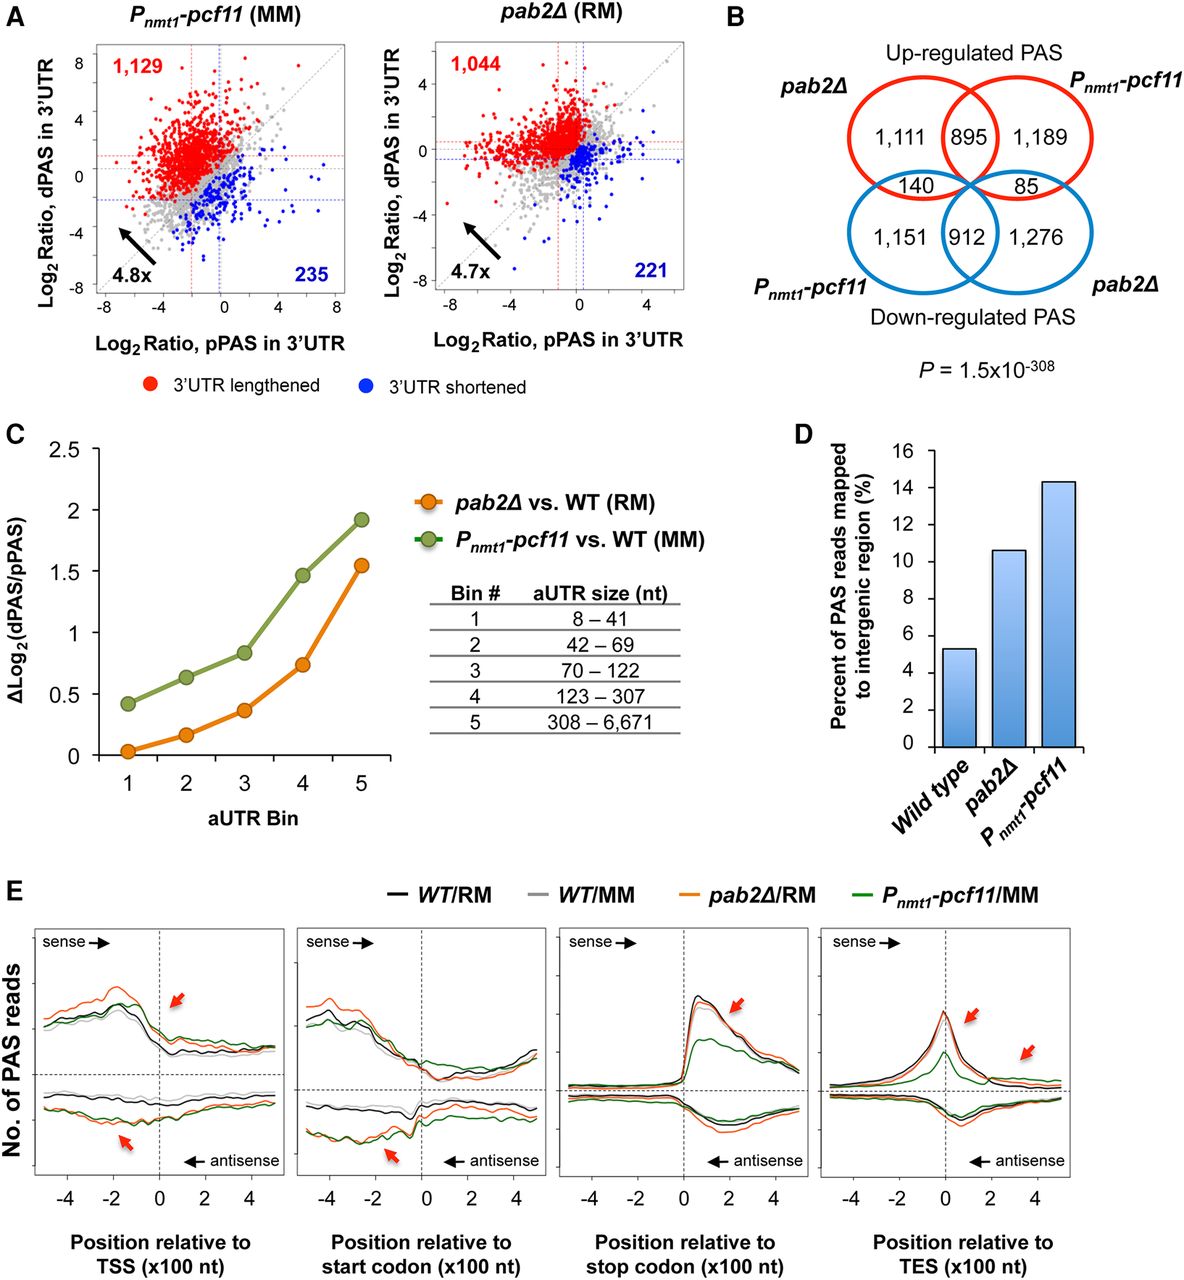
APA regulation by PA factors. (A) 3′ UTR APA analysis of Pcf11-deficient (Pnmt1-pcf11; left) and pab2-null (pab2Δ; right) strains of S. pombe. Each scatter plot compares expression change of proximal PAS isoform (pPAS, x-axis) between an analyzed strain and control, as well as that of distal PAS isoform (dPAS, y-axis) between the strains. Both pPAS and dPAS are in the 3′ UTR. Genes with shortened 3′ UTRs are highlighted in blue, and those with lengthened 3′ UTRs in red. Gene numbers for both types are shown, and their ratio (number of blue dots to number of red dots) is indicated. Note that Pnmt1-pcf11 was grown in minimal media (MM) and pab2Δ in rich media (RM). (B) Venn diagram comparing significantly regulated PASs in Pnmt1-pcf11 with those in pab2Δ cells. P-value (Fisher's exact test) is based on analysis of commonly regulated PASs. (C) Relationship between aUTR size (distance between proximal and distal PASs) and regulation of APA. The two most abundant 3′ UTR isoforms based on PAS reads were selected from each gene. APA regulation of each gene was based on the difference in log2(dPAS/pPAS) between an analyzed strain and control. A higher value indicates greater up-regulation of the distal PAS isoform. Genes were divided into five groups based on aUTR size. The average value of each group was plotted. (D) Percentage of PAS reads mapped to intergenic regions in wild type, pab2Δ, and Pnmt1-pcf11 strains. The data on wild type were based on both cells grown in RM and in MM. (E) Metagene analysis of PASs in different strains of S. pombe. Significantly altered PAS peaks are highlighted with red arrows.