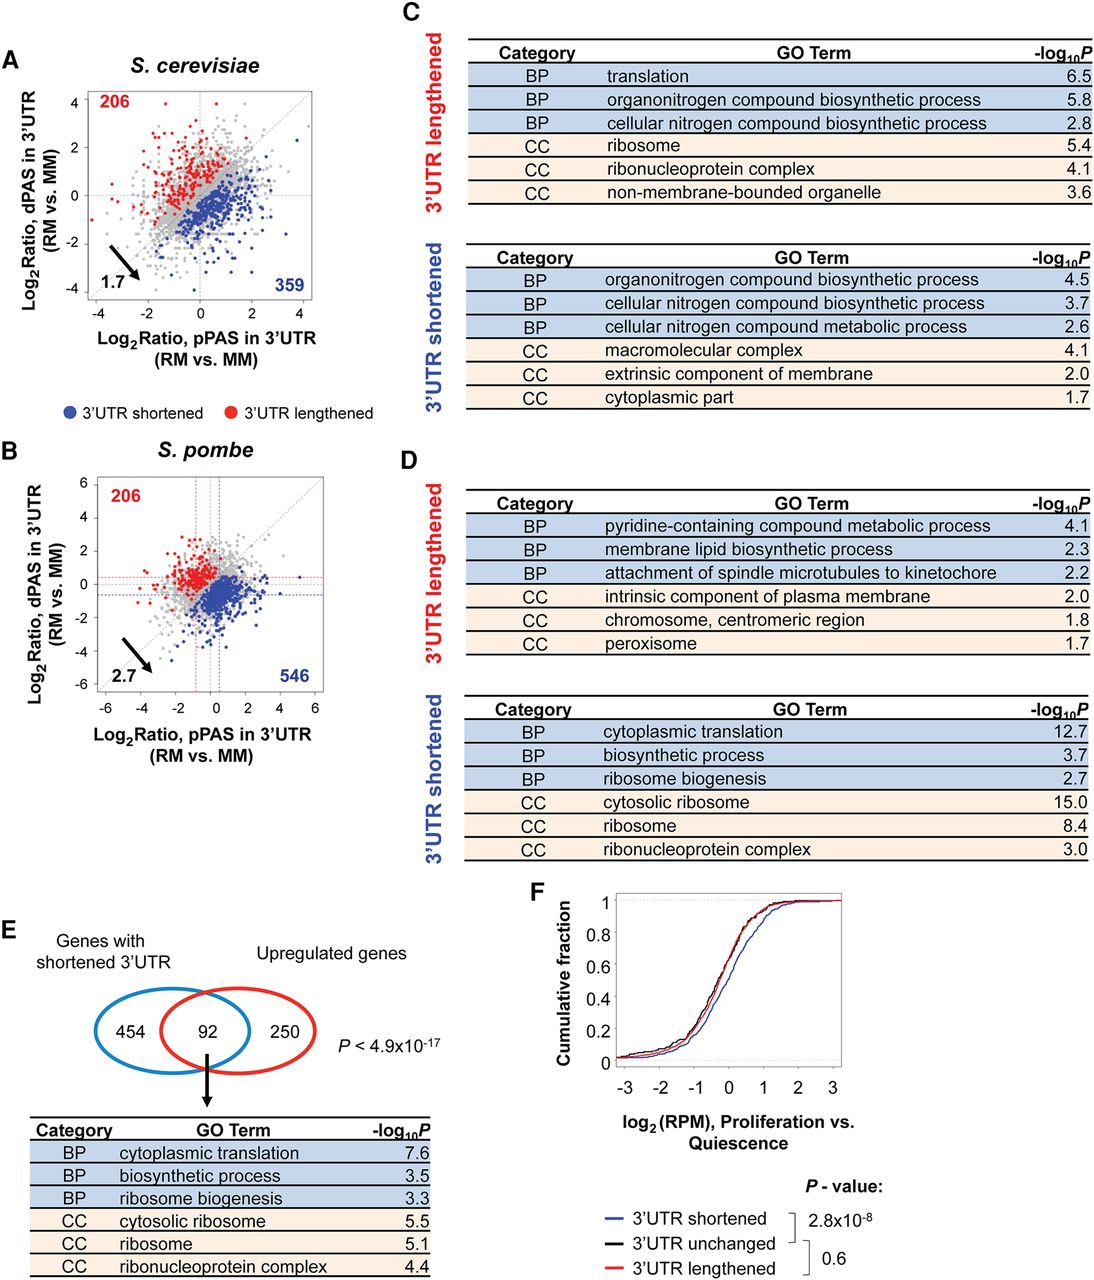
Alternative polyadenylation changes between cells grown in rich versus minimal media. (A) Scatter plot comparing expression changes of proximal PAS (pPAS) isoform (x-axis) between S. cerevisiae cells grown in rich media (RM) versus minimal media (MM) with that of distal PAS (dPAS) isoform (y-axis). Both pPAS and dPAS are in the 3′ UTR. Genes with shortened 3′ UTRs are highlighted in blue, and those with lengthened 3′ UTRs are in red. Gene numbers for both types are shown, and their ratio (number of blue dots to number of red dots) is indicated. (B) As in A, except that data for S. pombe are shown. (C,D) Top Gene Ontology (GO) terms associated with S. cerevisiae (C) or S. pombe (D) genes with shortened 3′ UTRs or lengthened 3′ UTRs in RM versus MM. (BP) biological process; (CC) cellular component. P-value is based on the Fisher's exact test. (E) Venn diagram comparing the genes with shortened 3′ UTRs and genes with up-regulated expression. The P-value (hypergeometric test) indicates the significance of overlap between two genes sets. The enriched GO terms are shown at the bottom with P-values indicated. (F) Distribution of gene expression changes in cell proliferation versus quiescence, as previously reported, for genes with different 3′ UTR changes as analyzed in B. P-values (K-S test) indicating significance of difference between different gene sets are indicated.