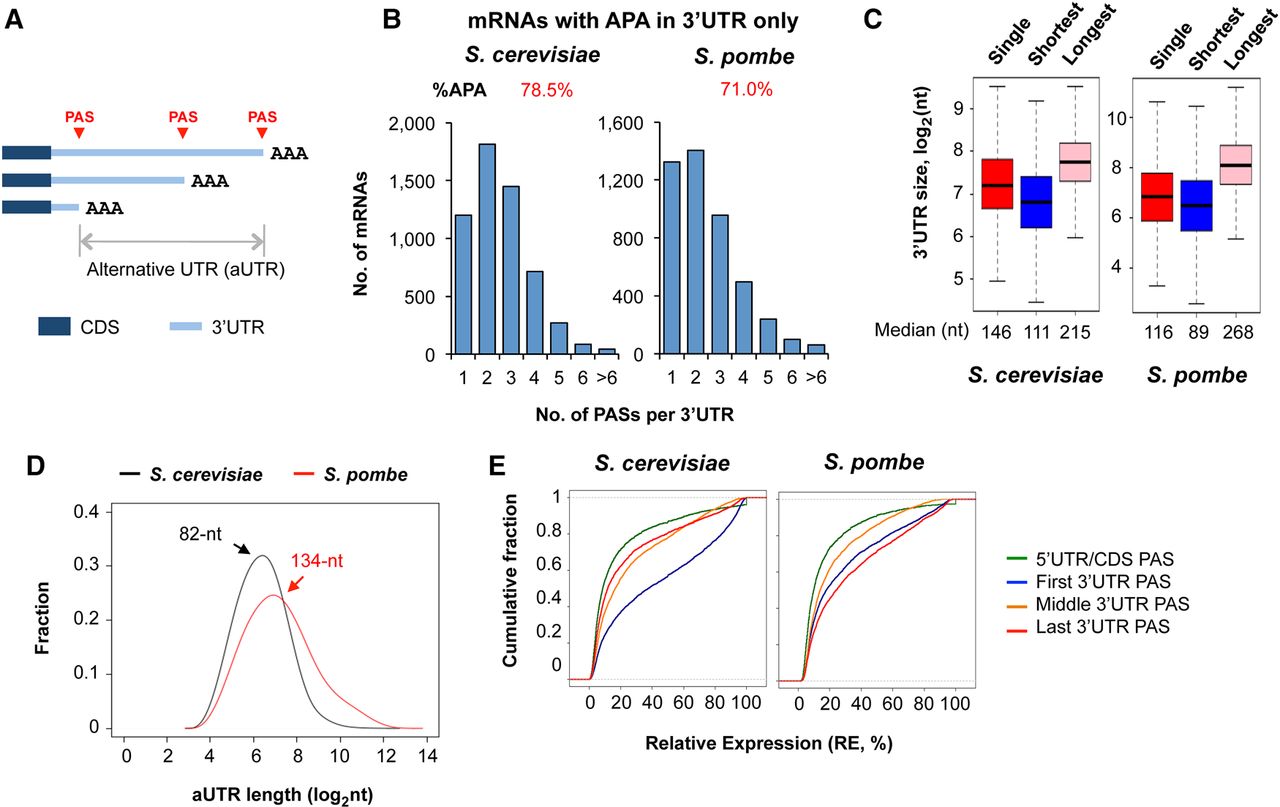
3′ UTR regulation by APA. (A) Schematic showing 3′ UTR length control by APA. The region between the first PAS and last PAS is called alternative UTR, or aUTR. (B) Number of mRNA genes with 3′ UTR APA sites in S. cerevisiae (5583 genes in total) (left) and S. pombe (4579 genes in total) (right). The percentage of mRNA genes with 3′ UTR APA is 78.5% in S. cerevisiae and 71% in S. pombe. The average number of 3′ UTR PASs per gene is 2.6 in S. cerevisiae and 2.5 in S. pombe. (C) Box plots of 3′ UTR size for genes without APA (single) and for genes with APA (the sizes of shortest and longest 3′ UTR isoforms were plotted). (D) Distance between the first and last PASs of genes with 3′ UTR APA. The average values for S. cerevisiae and S. pombe are indicated. (E) Relative expression levels of APA isoforms. APA isoform types were based on PAS locations, as indicated.