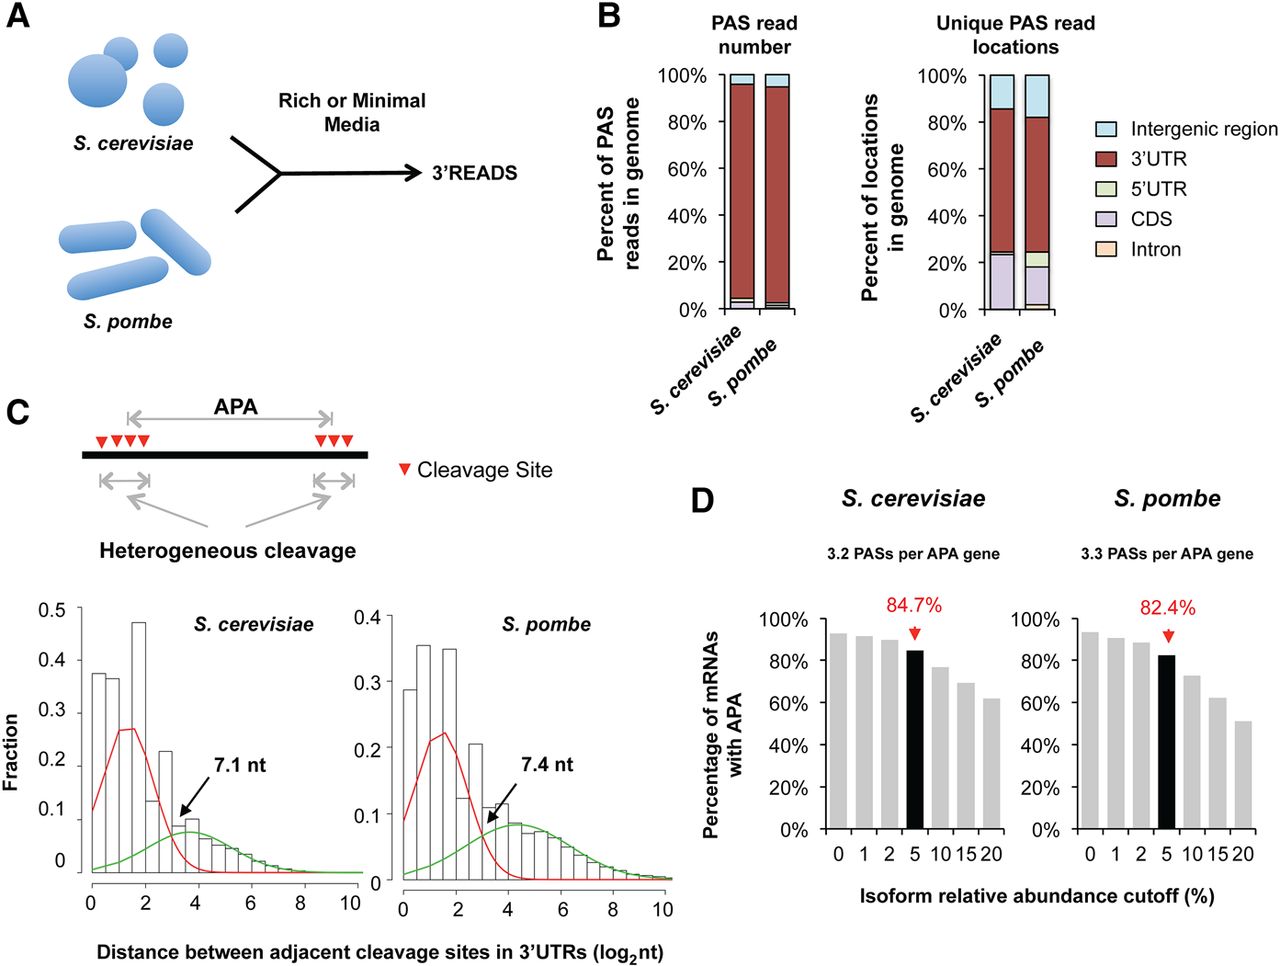
Mapping PASs in S. cerevisiae and S. pombe genomes. (A) Schematic showing the experimental design. (B) Statistics of PAS reads mapped to different regions of S. cerevisiae and S. pombe genomes (left) and unique PAS read locations (right). See Methods for definition of PAS read. (C, top) Schematic showing the difference between heterogeneous cleavage and APA. Heterogeneous cleavage sites are merged to a PAS cluster. (Bottom) Distributions of distances between adjacent CSs in S. cerevisiae (left) and S. pombe (right). Two distribution modes were identified by the maximum expectation method (Methods), with the red line showing the distance between CSs within a PAS cluster and the green line the distance between CSs from different PAS clusters. The crossover point (indicated by arrow) was identified for each plot, which was used to group CSs into PAS clusters. (D) APA frequencies of mRNA genes in S. cerevisiae (left) and S. pombe (right). Different abundance cutoffs were used for calling APA sites, leading to different APA frequencies as indicated. The overall APA frequencies were 84.7% and 82.4% in S. cerevisiae and S. pombe genomes, respectively, when the relative abundance cutoff was set at 5%.