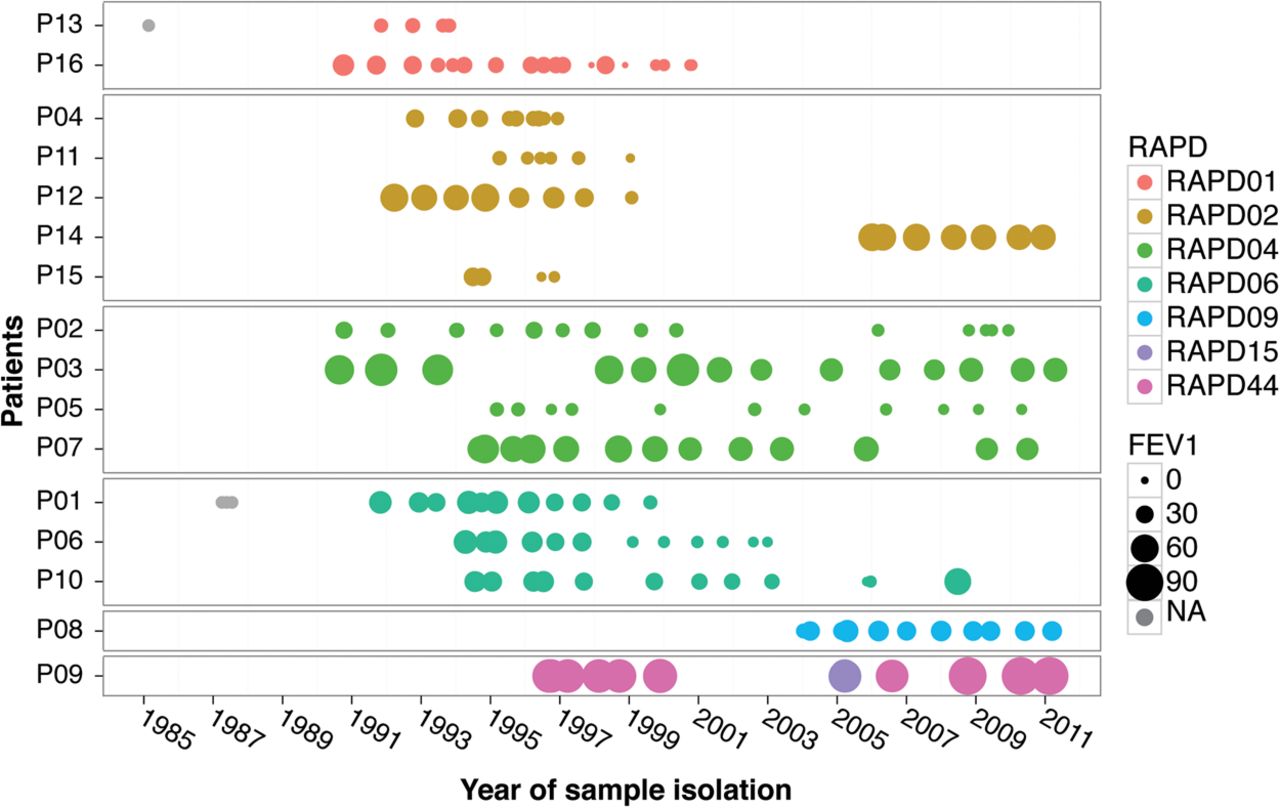
Figure 2.
Longitudinal series of B. cenocepacia isolates. Each series (collected from patients P01 to P16) is depicted as a row of dots to represent sampling time points. Colors indicate different RAPD genotypes, and relative dot size indicates patient lung function (%FEV1) at that time point. Gray circles indicate no associated %FEV1 (percentage of predicted forced expiratory volume in 1 sec) measurement (also see Supplemental Fig. S1).