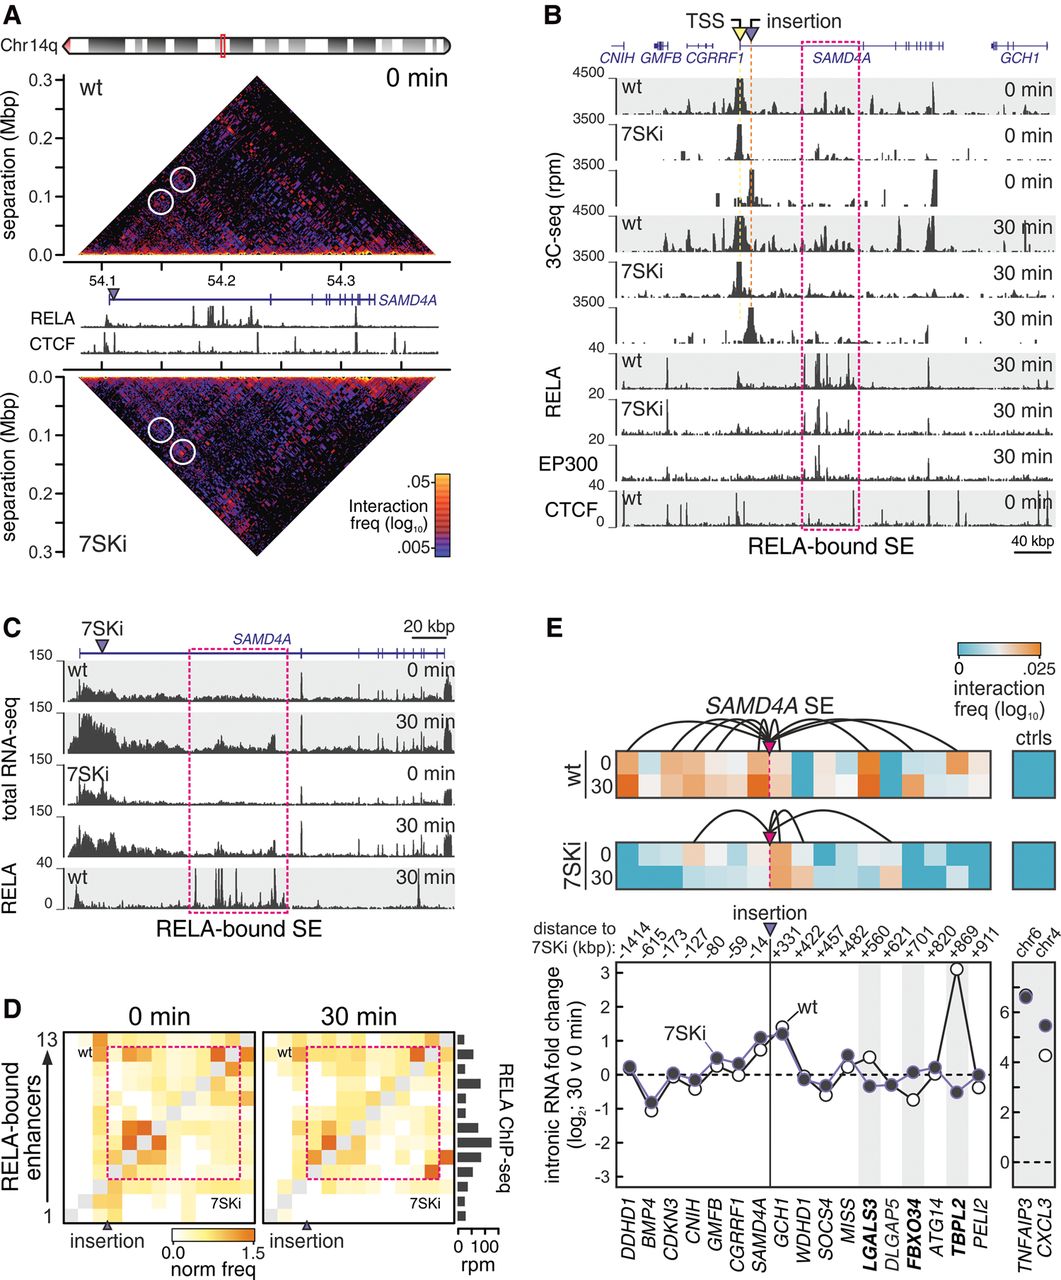
Inserting the RN7SK promoter in SAMD4A alters NF-κB–driven spatial interactions. Wild-type (wt) or 7SKi HUVECs (a single cell-derived clone with the RN7SK promoter inserted 13.5 kbp downstream from the SAMD4A TSS) were treated with TNF for 0 or 30 min. (Purple triangles) Insertions, (magenta boxes) intronic SAMD4A enhancer cluster. (A) T2C contact maps. (White circles) Two exemplary interactions of the SAMD4A TSS that differ in the two cell populations. One (left) involves contacts with the intronic enhancer cluster, the second (right) with the CTCF site immediately downstream from the enhancer cluster. RELA and CTCF ChIP-seq tracks are also shown below the SAMD4A gene model. (B) 3C- and ChIP-seq data (in reads per million) from wt (gray background) and 7SKi HUVECs. (Yellow triangle) 3C-seq viewpoint at the SAMD4A TSS, (purple triangle) 3C-seq viewpoint at the RN7SK insertion. (C) Total RNA- and ChIP-seq data (in reads per million) from wt (gray background) and 7SKi HUVECs along the SAMD4A locus. (D) Interactions captured by T2C between the 13 RELA-bound enhancers at 0 and 30 min in the two cell populations; RELA ChIP-seq levels for each peak are also shown (right). (E) (Top) Interactions captured by T2C between the intronic SAMD4A enhancer cluster (“SE”) and gene TSSs within 3 Mbp. All interactions with ≥0.013 rpm are indicated by the spider plot. (Bottom) Log2-fold changes in intronic RNA levels after 30 min of TNF stimulation of genes in the extended locus (iRNA-seq data); noncontacted TNFAIP3 and CXCL3 serve as controls.