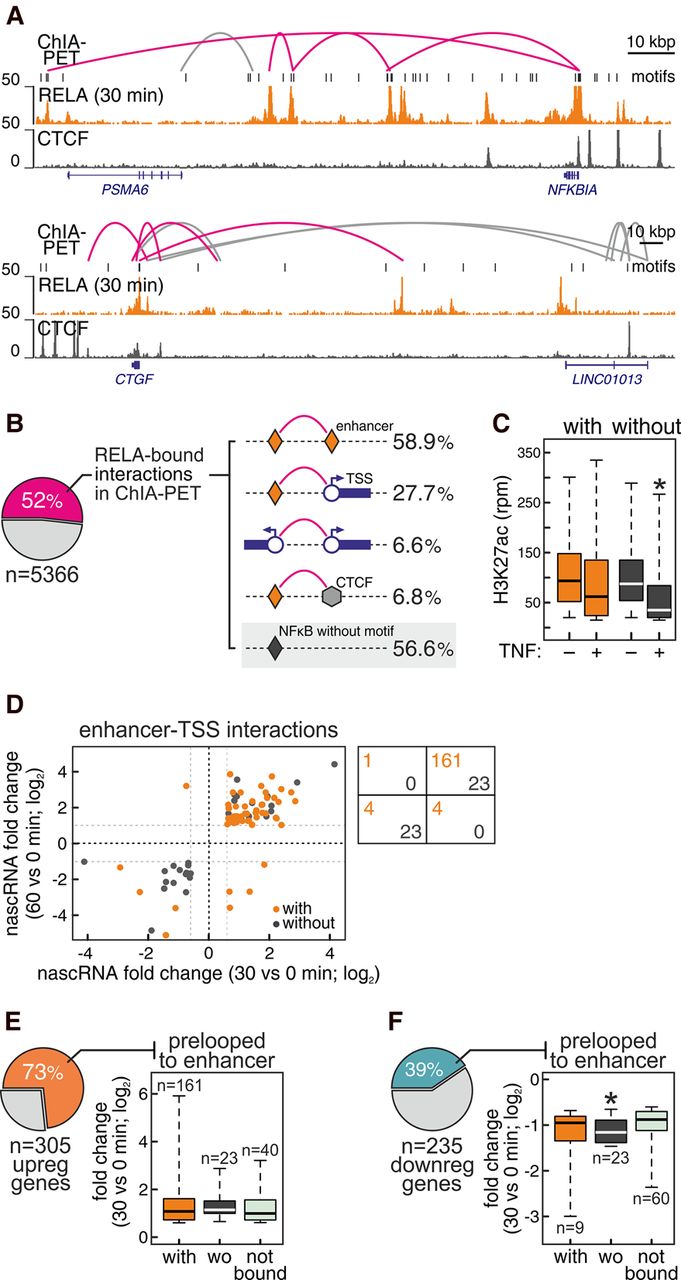
Global analysis of contacts made by RELA-bound enhancers “with” or “without” motif. HUVECs were stimulated with TNF for 0 or 30 min, and ChIA-PET was performed after pulling-down chromatin complexes associated with active RNA polymerase II isoforms. (A) Browser views of typical ChIA-PET interactions at gene loci induced (NFKBIA) or repressed (CTGF) by TNF. 0-min ChIA-PET contacts are shown alongside ChIP-seq data for RELA (30 min) and CTCF (0 min), and positions of canonical NF-κB motifs. RELA-bound contacts are highlighted (magenta). (B) More than half of the 5366 RELA-bound enhancers (defined as in Fig. 2B) are involved in 0-min ChIA-PET interactions, and are connected to other already-active enhancers (orange), gene TSSs (circles), or CTCF cites (hexagons) to different extents. Fifty-seven percent of RELA-bound enhancers carry noncanonical motifs (gray highlight). (C) Boxplots showing H3K27ac levels (using ChIP-seq ±TNF) at each of the 2791 RELA-bound enhancers present in the 0-min ChIA-PET data. Enhancers are grouped according to their underlying motif as “with” (orange) or “without” (gray). (*) Significantly different mean; two-tailed, unpaired, Student's t-test. (D) Log2-fold changes of intronic RNA levels (30- or 60- versus 0-min; only changes of ±0.6 or more are shown) for genes connected with RELA-bound enhancers in 0-min ChIA-PET data. Genes associated to “with” and “without” RELA peaks are denoted by orange and gray points, respectively, and their numbers per quartile are shown (right). (E) Pie chart showing that 73% of the 305 TSSs of up-regulated genes in 0-min ChIA-PET are prelooped to already-active enhancers. Boxplots depict the log2 fold-change in intronic RNA levels for genes contacting “with” (orange), “without” (gray) or non-RELA-bound peaks (light green). (F) Pie charts and boxplots as in E, but for the 39% of the 235 TSSs of down-regulated genes in 0-min ChIA-PET that are prelooped to already-active enhancers. (*) Significantly different mean; two-tailed, unpaired, Student's t-test.