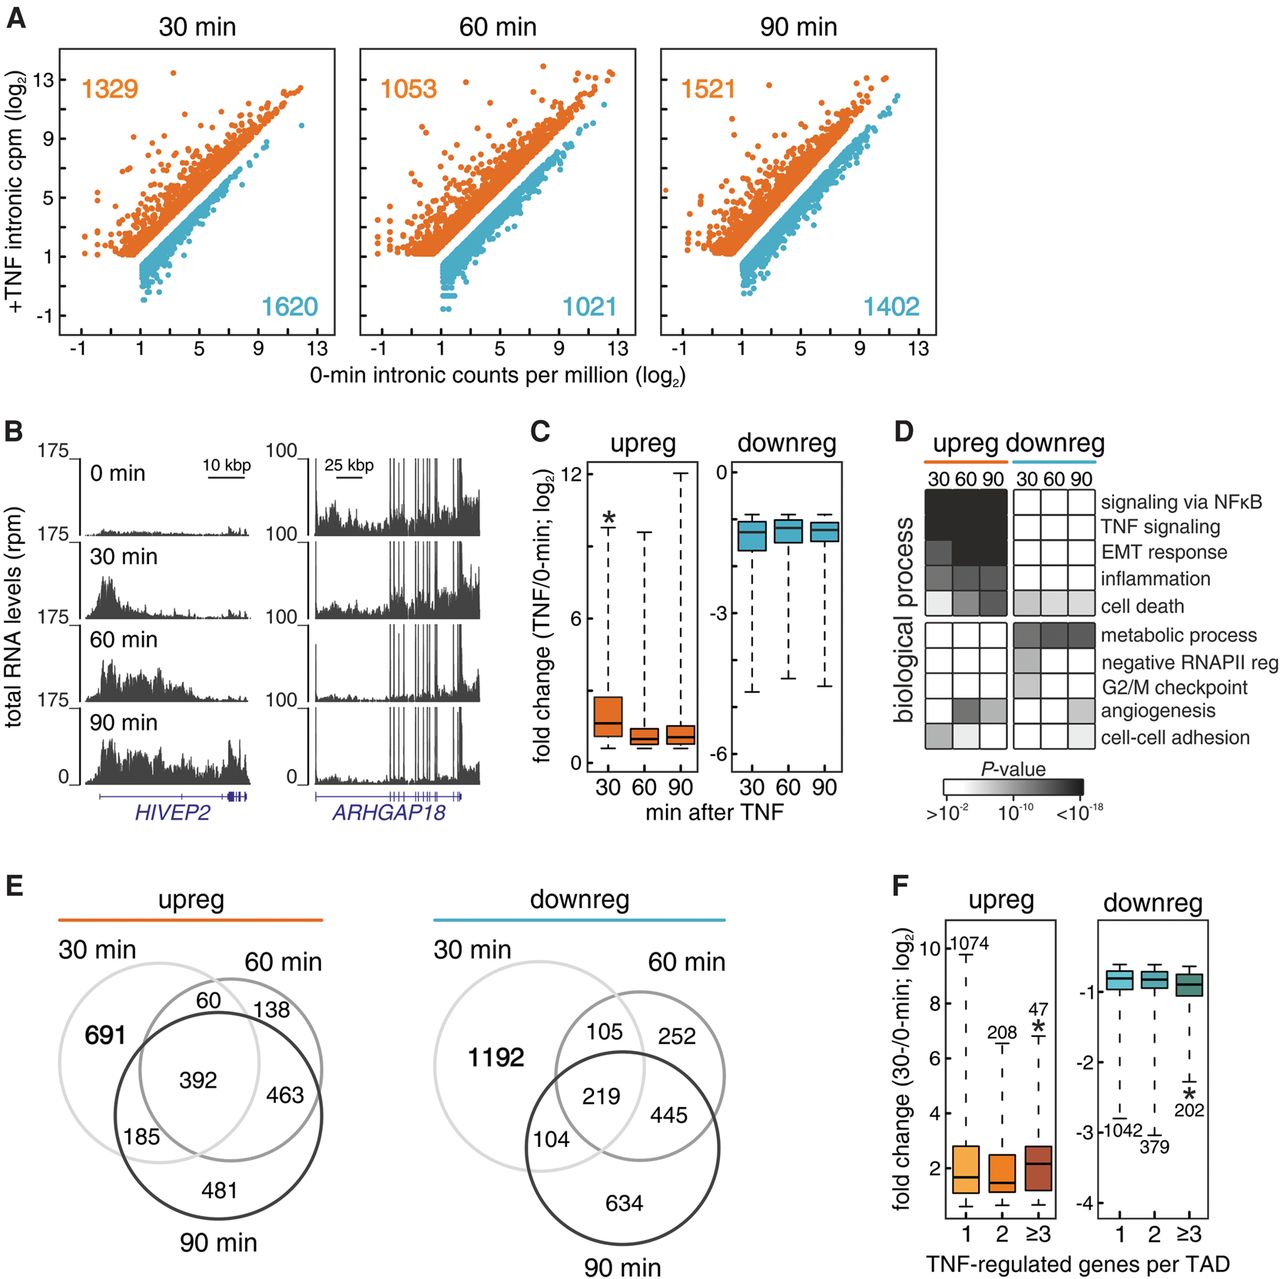
Analysis of gene expression at the level of intronic RNA. HUVECs were treated with TNF for 0–90 min, total RNA sequenced, and changes in intronic RNA levels assessed using the iRNA-seq pipeline. (A) Log2-normalized mean counts of reads mapping to introns at the different times. Only genes up- (orange) and down-regulated (blue) by TNF are shown. (B) Browser views of typical RNA-seq coverage (reads per million) along a TNF-induced (HIVEP2) and a TNF-repressed gene (ARHGAP18). (C) Log2-fold changes of intronic RNA levels for up- (≥0.6) and down-regulated genes (≤−0.6) at the different times compared to 0 min. (*) Significantly different mean; P < 0.01, two-tailed Student's unpaired t-test. (D) The five most significantly enriched GO terms relevant to up- and down-regulated genes. (E) Venn diagrams showing shared and unique up- (left) and down-regulated genes (right) at the different times post-stimulation. (F) Log2-fold changes of intronic RNA levels (30- versus 0-min levels) for TNF-induced/-repressed genes lying alone (“1”), in pairs (“2”), or in groups of three or more (“≥3”) in a given TAD (the total number of genes in each group are shown on top of or below each box plot). (*) Significantly different mean; P < 0.01, two-tailed Student's unpaired t-test.