Figure 3.
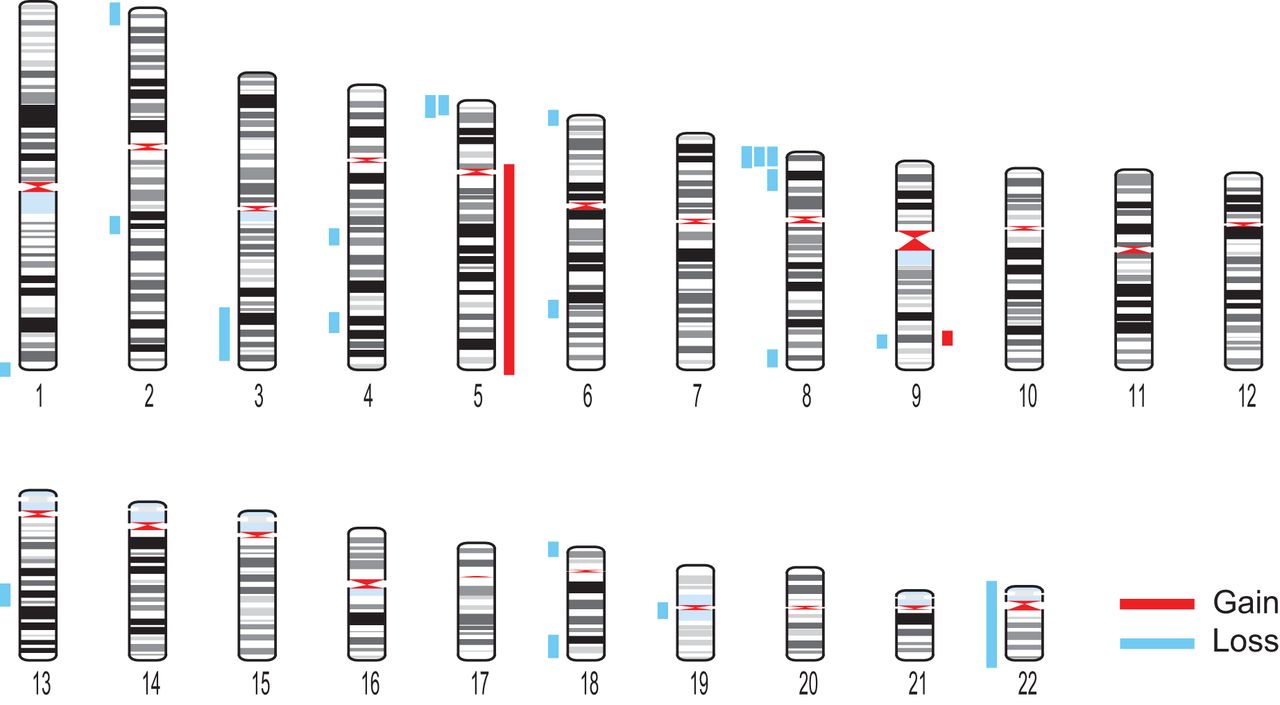
Megabase-scale CNVs in somatic cells. Karyogram showing the 23 gains and losses identified across 80 brain cells and 52 skin cells with VS <0.26. Gains and losses are represented by red and blue bars, respectively.
Megabase-scale CNVs in somatic cells. Karyogram showing the 23 gains and losses identified across 80 brain cells and 52 skin cells with VS <0.26. Gains and losses are represented by red and blue bars, respectively.