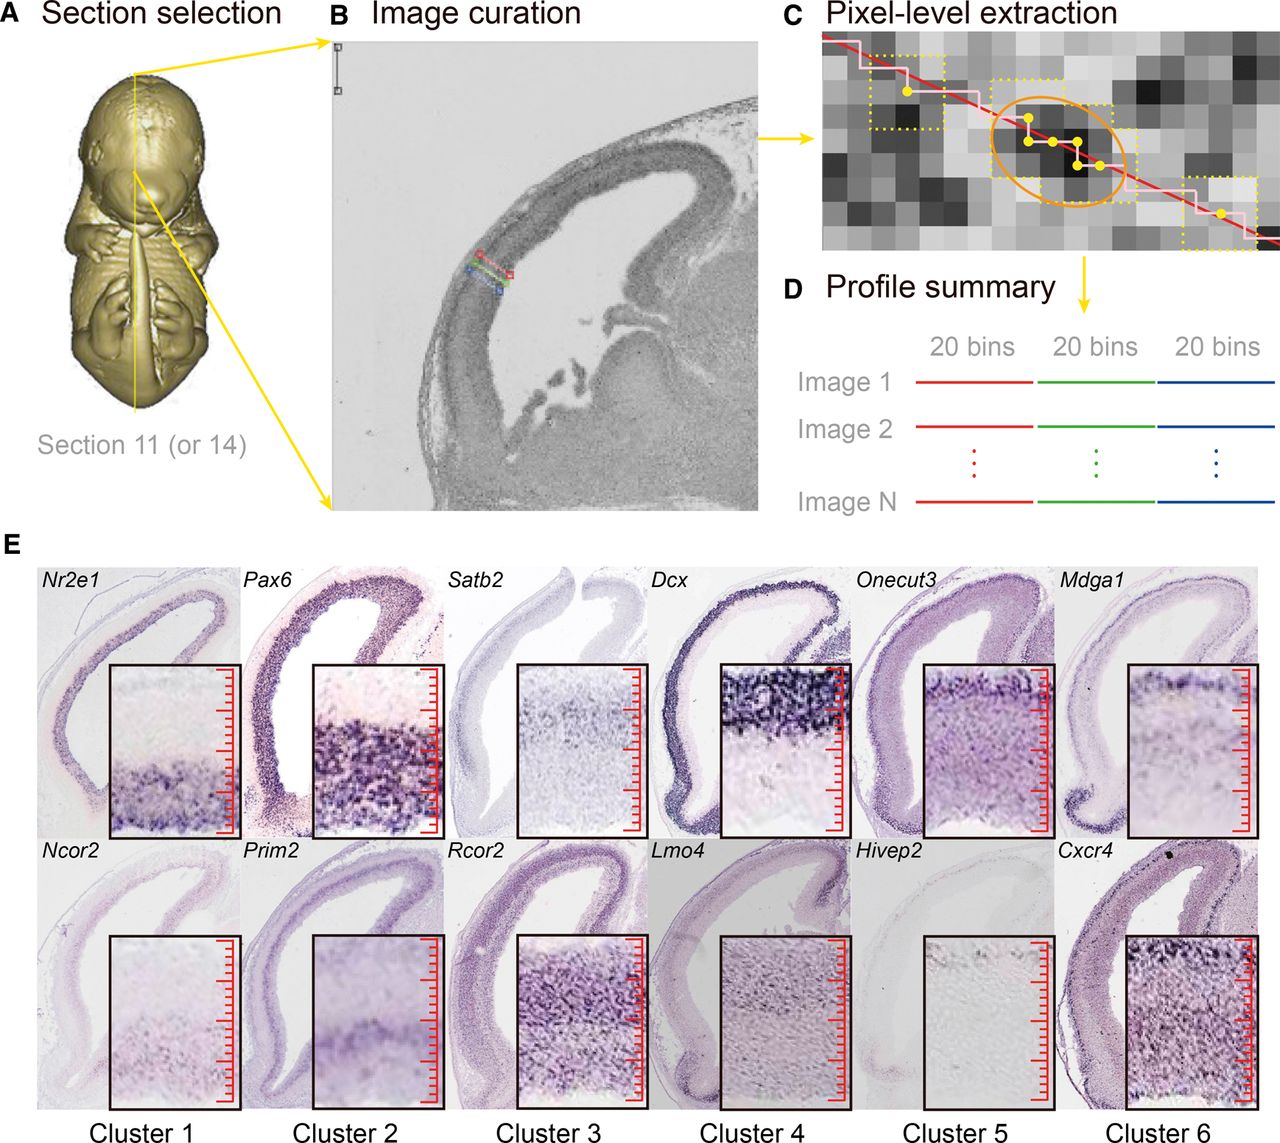
Workflow to extract and digitize expression profiles. (A) The middle-most sagittal section (Section 11 or 14) was selected for expression profile measurements. The Eurexpress 3D online mouse embryo model is here used to illustrate the relative position of Section 11. (B) A MATLAB graphical interface was used for manually curating three radial lines across the cerebral cortex. Another line at the top left of the image was cropped for background correction. (C) Mean intensity values of every nine neighboring pixels (shown as dotted 3 × 3 squares) on the cropped line were extracted as a vector of smoothed expression intensities. The region of approximately a single cell (marked by the orange eclipse) can be captured with smoothed intensities in six pixels—the average length of a bin. (D) Each line was scaled to a 20-bin profile to represent the expression profile of a gene across the radial axis from CP to VZ. Then, the profiles for all telencephalon-expressed genes were summarized on a matrix of genes versus their expressions in 3 × 20 bins. (E) The representative Eurexpress ISH images with different expression patterns. In the zoomed-in panels (bottom to top, VZ to CP), the high-resolution ISH images display the signals and scales for single cells relative to the size of each radial bin as indicated by the 20-bin red rulers. Image sources are euxassay_007249_11.jpg, euxassay_009400_11.jpg, euxassay_017942_14.jpg, euxassay_003376_11.jpg, euxassay_018949_14.jpg, euxassay_009808_14.jpg, euxassay_009545_11.jpg, euxassay_004815_14.jpg, euxassay_019619_11.jpg, euxassay_008979_11.jpg, euxassay_011139_11.jpg, and euxassay_006007_11.jpg, respectively, from top to bottom and left to right.