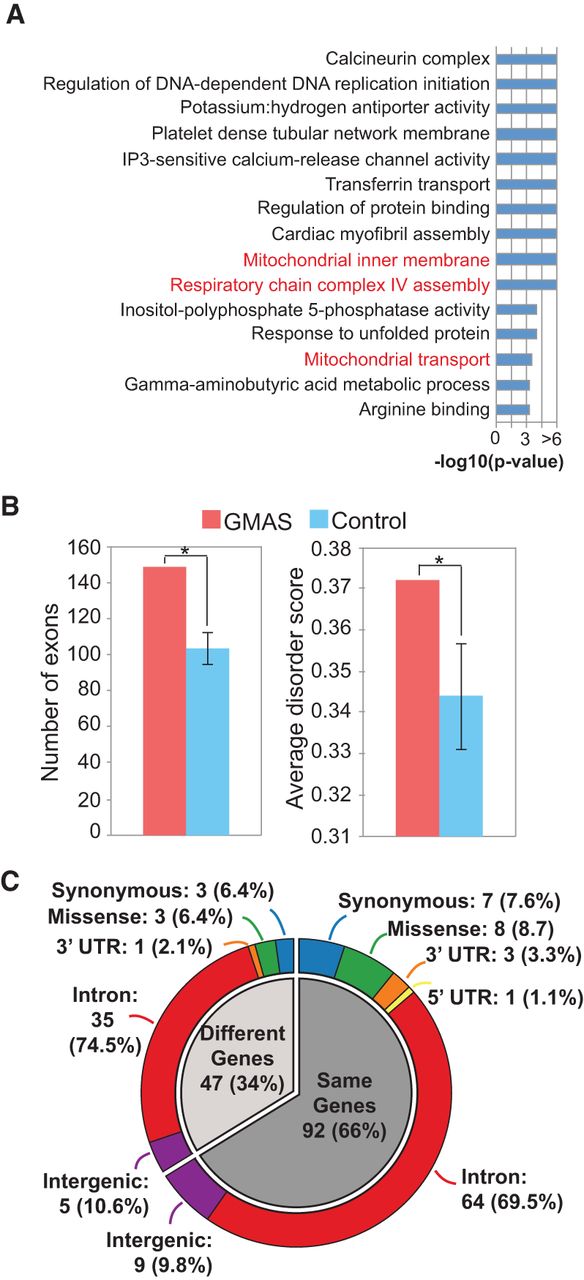
Functional relevance of GMAS events. (A) Enriched GO terms among GMAS genes. The GO terms are ranked by P-values. Mitochondrial-related terms are colored in red. (B) Intrinsically disordered regions (IDRs) overlapping GMAS exons. (Left) Number of GMAS and number of control exons (mean and SD of 1000 sets of controls) overlapping IDRs. GMAS exons are more often located in IDRs than are control exons. (Right) Average disorder scores of amino acids in GMAS and control exons (mean and SD). (*) P < 0.05, based on the empirical distribution of 1000 control sets. (C) Genomic context of GWAS SNPs (outer ring) located in the same genes as GMAS SNVs (inner pie; darker gray) or different genes as GMAS SNVs (inner pie; light gray). Most GWAS SNPs are located in introns, whose functions were elusive.