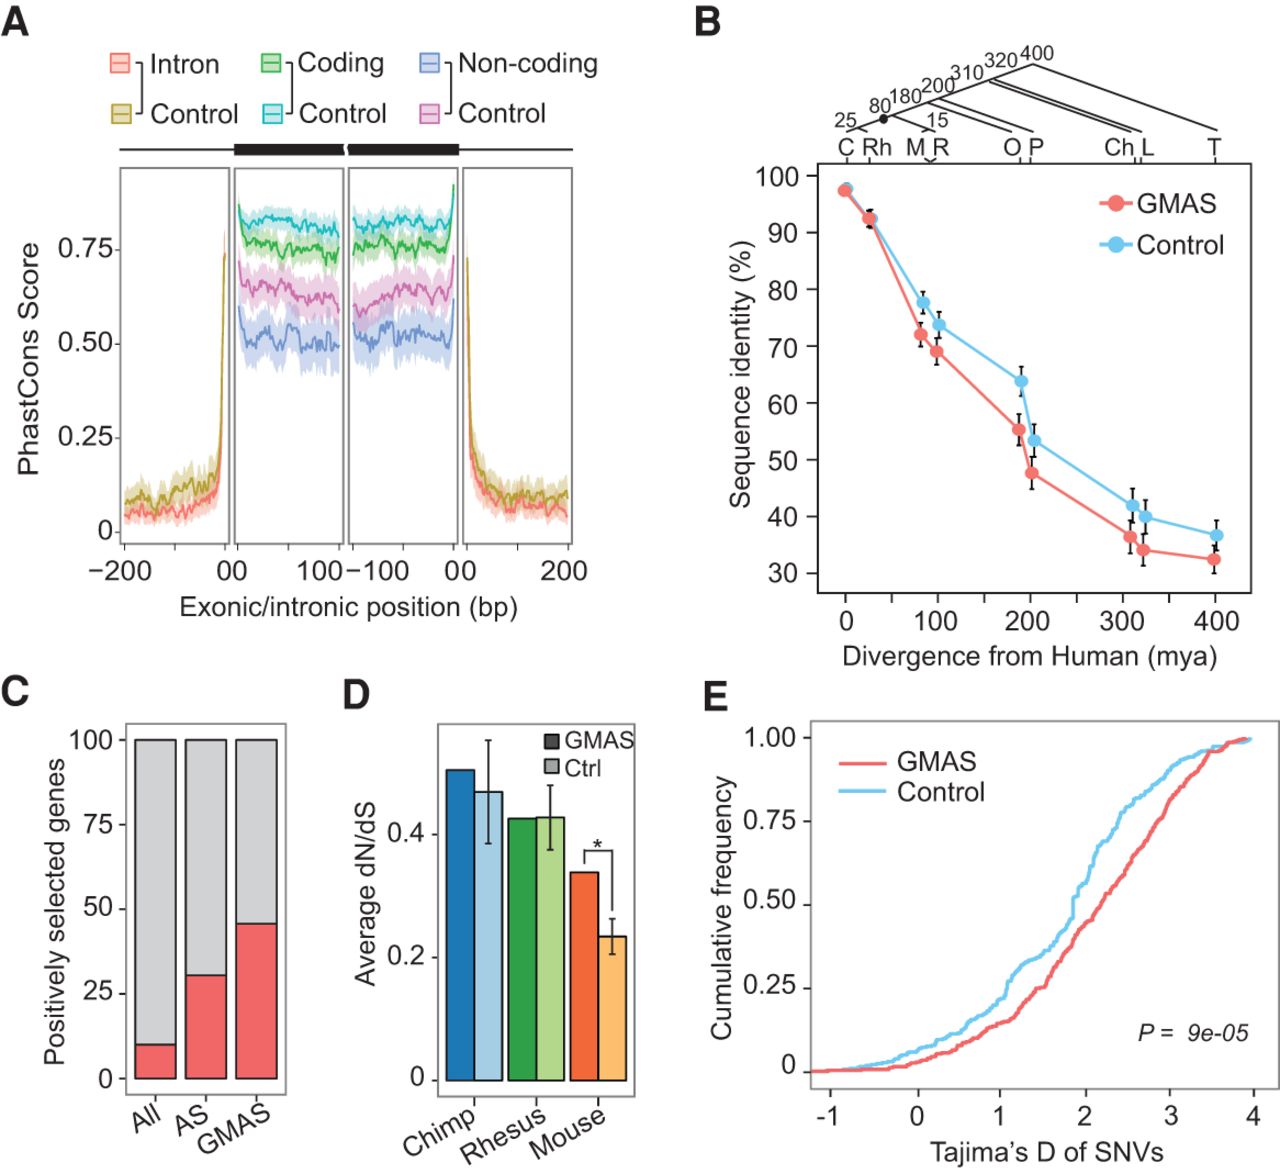
GMAS events undergo accelerated evolution. (A) Conservation profile (mean and 95% confidence interval of 46-way PhastCons scores) of GMAS exons and flanking introns. GMAS exons were separated into coding and noncoding groups with corresponding control exons of the same type. (B) Percentage of sequence identity (mean and 95% confidence interval) of GMAS exons (red) and control exons (blue) between human and each of the organisms shown in the graph. Estimated divergence times of each species from human (in million years [mya]) are shown along the x-axis and in the phylogenetic tree. (C) Chimpanzee; (Rh) rhesus macaque; (M) mouse; (R) rat; (O) opossum; (P) platypus; (Ch) chicken; (L) lizard; and (T) tetraodon. (C) Percentage of genes that are under positive selection according to the Selectome database. The analysis was conducted for all known human genes, AS genes according to ENCODE RNA-seq data used in this study, and GMAS genes. GMAS genes are more often positively selected (P < 2.2 × 10⁻¹⁶ compared with all human genes, P = 3.4 × 10⁻¹³ compared with AS genes, Fisher's exact test). (D) dN/dS values (mean and SD) of coding GMAS exons comparing human versus chimpanzee, human versus rhesus macaque, or human versus mouse. Results for GMAS exons and control exons are shown in darker and lighter colors, respectively. Control exons used in this graph were randomly picked AS exons with similar PSI values as GMAS exons as calculated using brain RNA-seq data (Supplemental Methods). The average dN/dS ratio of GMAS coding exons between human and mouse is significantly greater than that of control exons (*P < 0.001 based on empirical distribution of 1000 control sets). (E) Tajima's D values of GMAS (red) and control SNPs (blue) in the CEU population. The P-value was obtained from the Kolmogorov–Smirnov test.