Figure 3.
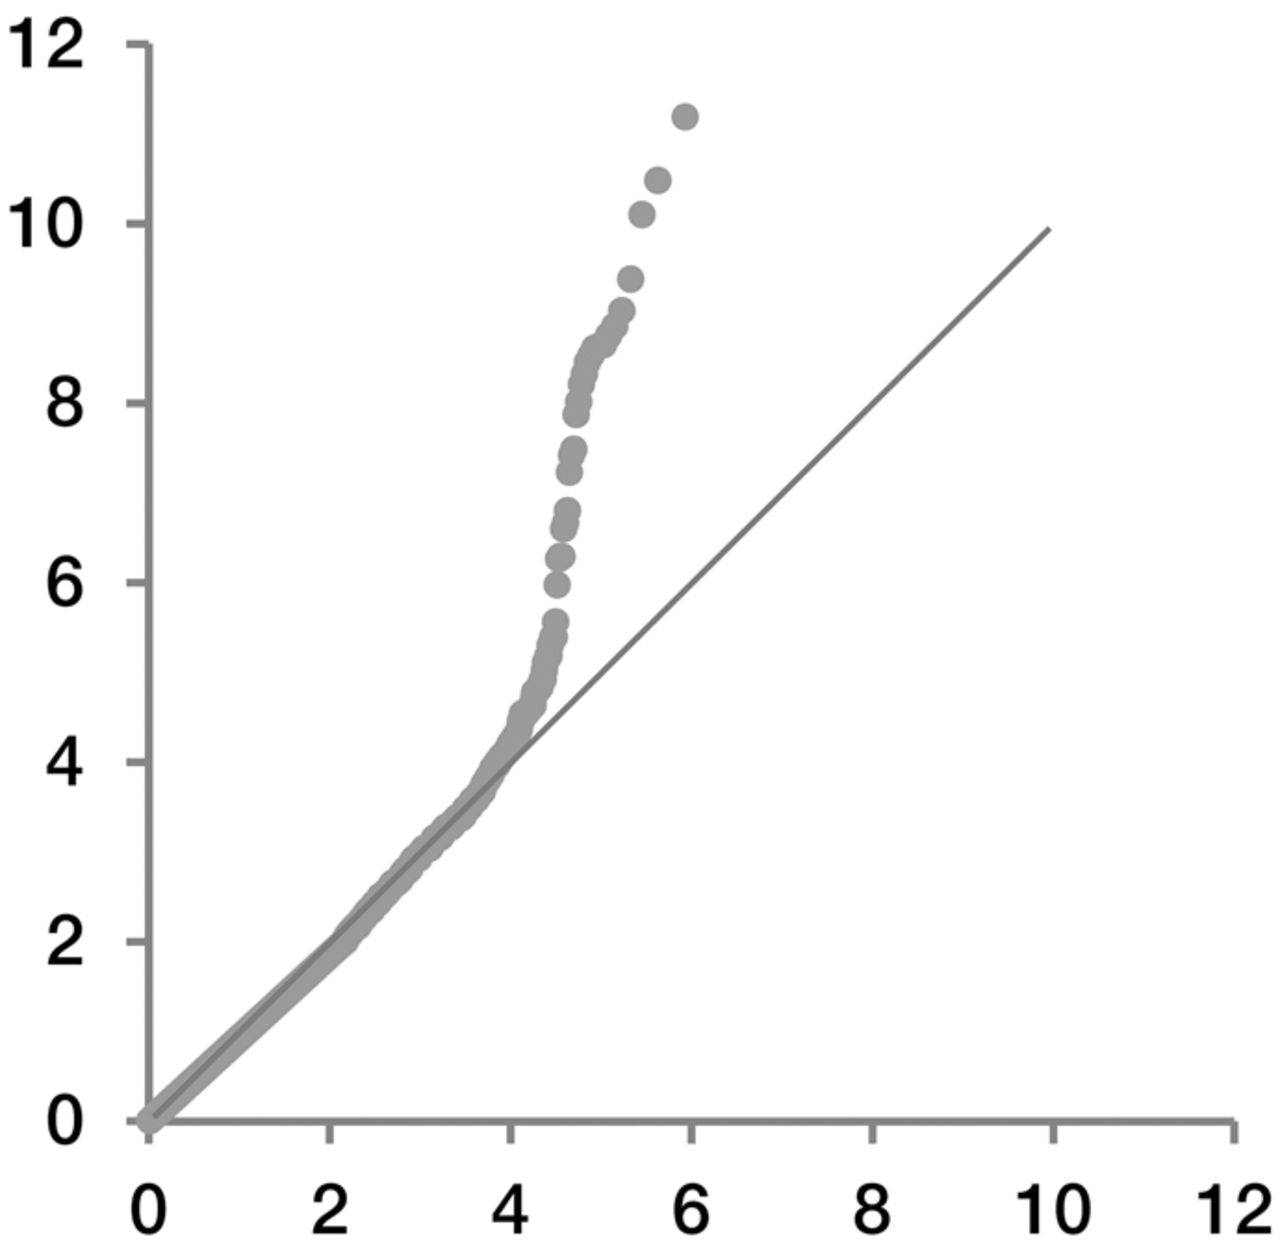
QQ plot of single-variant analysis of Han-Tibetan data. Observed significance levels are represented on the y-axis on a scale of −log10(P-value). Expected quartile is represented on the x-axis on the same scale.
QQ plot of single-variant analysis of Han-Tibetan data. Observed significance levels are represented on the y-axis on a scale of −log10(P-value). Expected quartile is represented on the x-axis on the same scale.