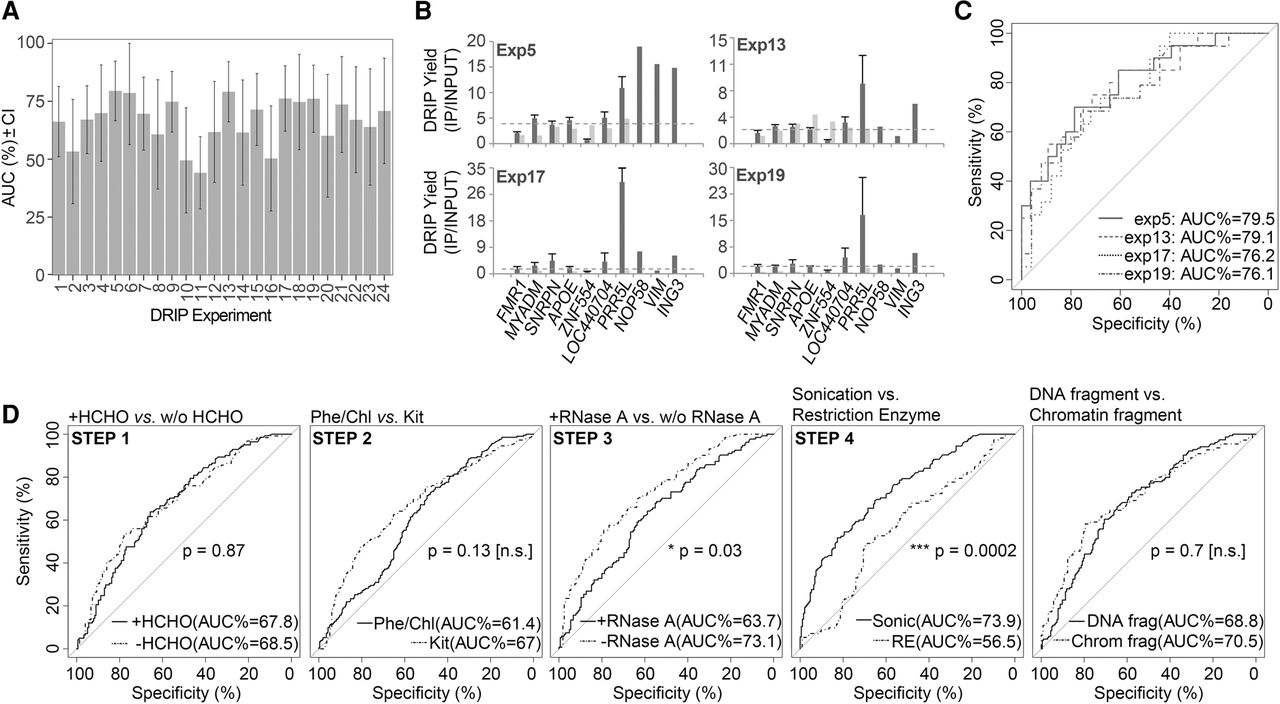
Good DRIP practice. (A) Bar charts showing the distribution of AUC (area under the curve) values of ROC plots for 24 DRIP classifiers. Error bars represent the confidence interval of AUCs. High (>0.7) AUC values were obtained for 10 DRIP classifiers (exp. 5, 6, 13, 15, 17, 18, 19, 21, and 24). Low (∼0.5) AUC values were obtained in four DRIP experiments (exp. 2, 10, 11, and 16). We highlight these groups as “preferred” and “not preferred,” respectively. (B,C) The top four DRIP experiments ranked by AUCs (exp. 5, 13, 17, and 19). (B) DRIP-qPCR enrichment scores are displayed over the test regions. Horizontal dotted lines represent the cutoff value (calculated from the ROC curves) separating the true R-loop signal from background. (C) ROC curves of the top four experiments. (D) Paired-ROC plots, comparing the main variables (steps) of the DRIP experiments. The level of statistical significance was 0.05.