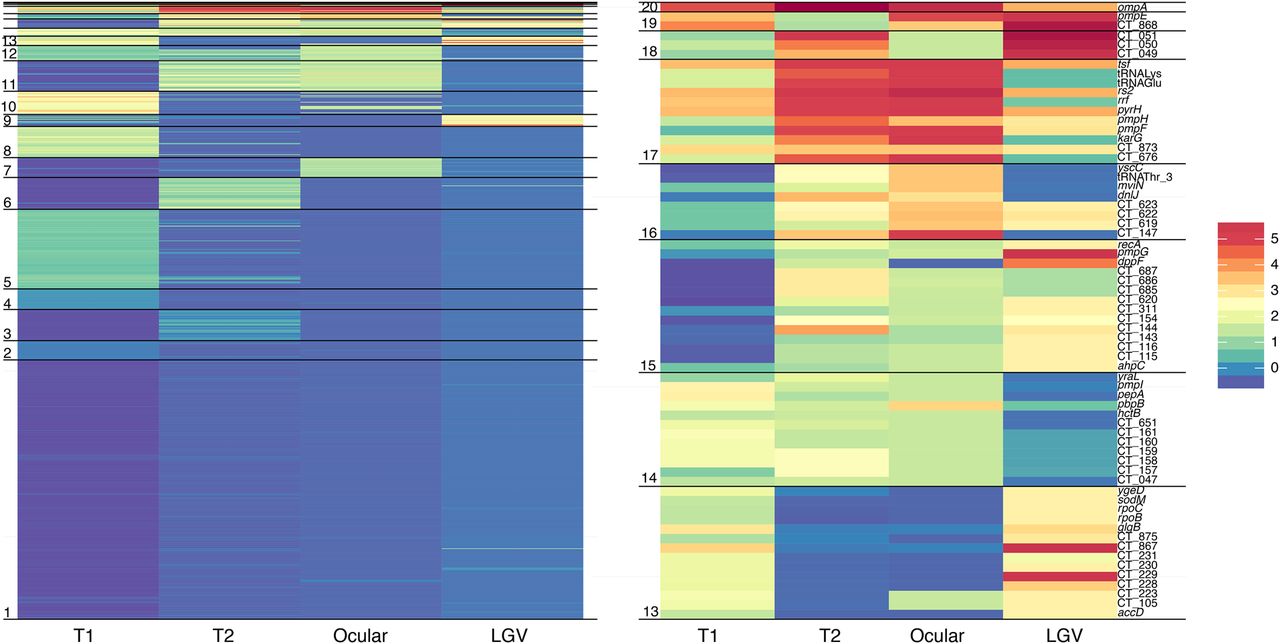
Figure 3.
Clustering of genes by recombination frequency in each lineage reveals lineage-specific profiles. Each horizontal line represents a gene with colors corresponding to standard deviations from the clade-specific mean. (Right) Expansion of the seven most actively recombining clusters. Clusters do not necessarily represent order of genes along the genome.