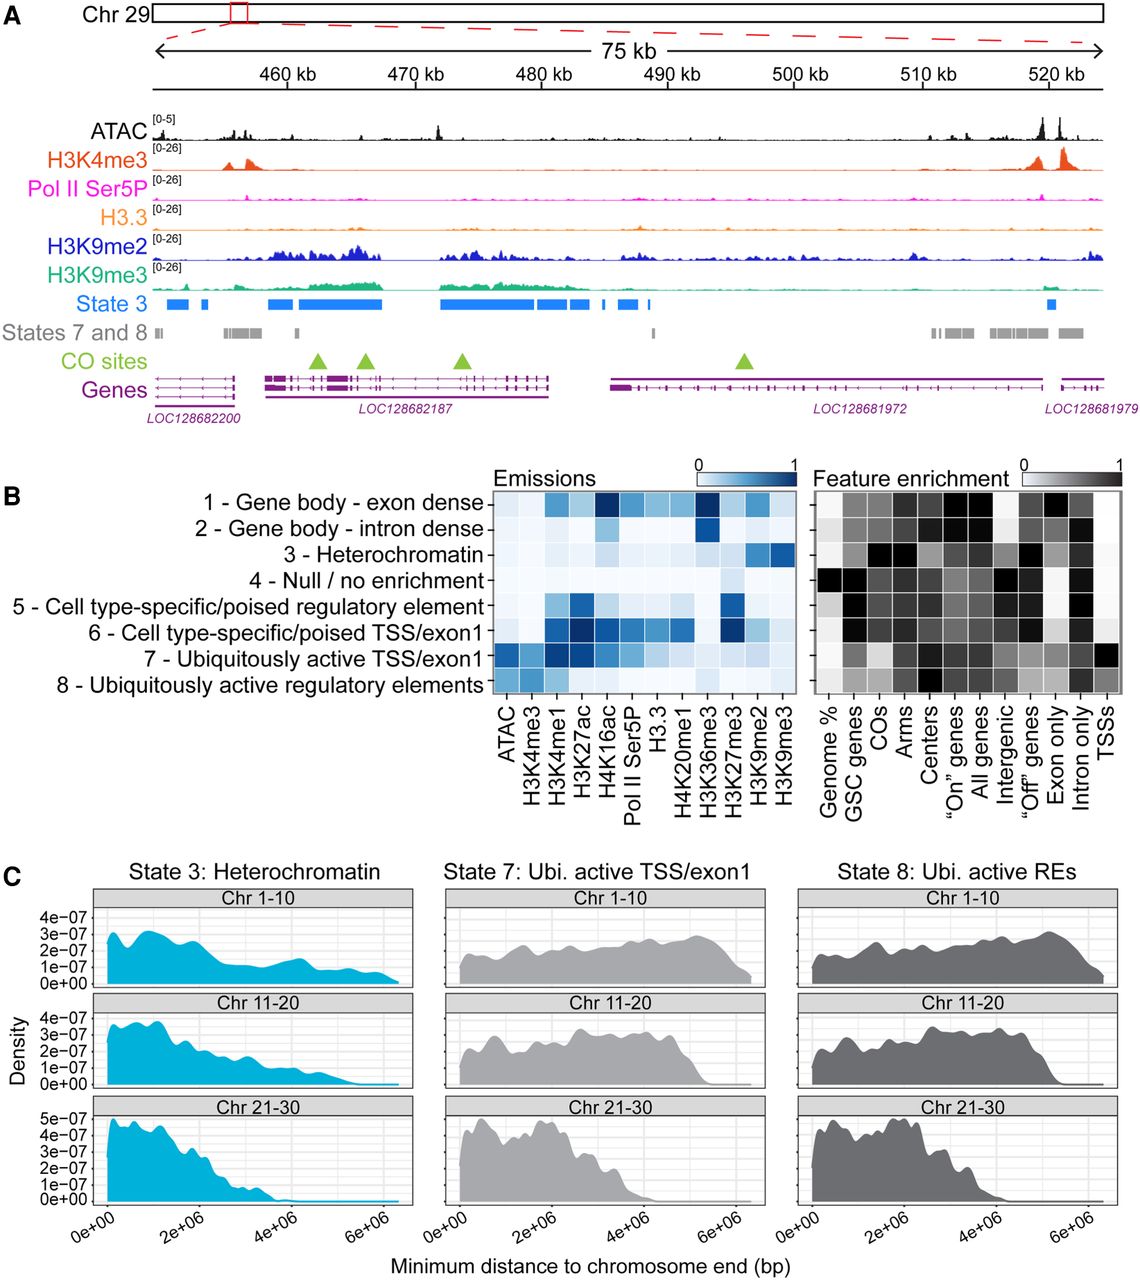
COs occur in heterochromatic regions of the genome in Plodia. (A) Screenshot of select CUT&RUN and ATAC-seq tracks for a representative genomic locus on Chr 29. Each track represents merged views of two to four biological replicates. (B, left) Eight-state ChromHMM model emission values; darker blue indicates a higher likelihood of finding that mark in that state. (Right) Heat map showing enrichment for specific features (listed below) in each state; darker black indicates a higher likelihood of that feature being in that state. Columns have been divided by column-wise maximum. (C) Histogram showing the minimum distance of state designations (states 3, 7, and 8) from the end of a chromosome, in which the number of loci is binned using 30 kb windows. The genome was subdivided into three chromosome-sized groups, with Chr 1–10 (largest; 12.65–10.82 Mb) shown at the top, Chr 11–20 (10.56–8.45 Mb) shown in the middle, and Chr 21–30 (smallest; 8.34–3.98 Mb) shown at the bottom.