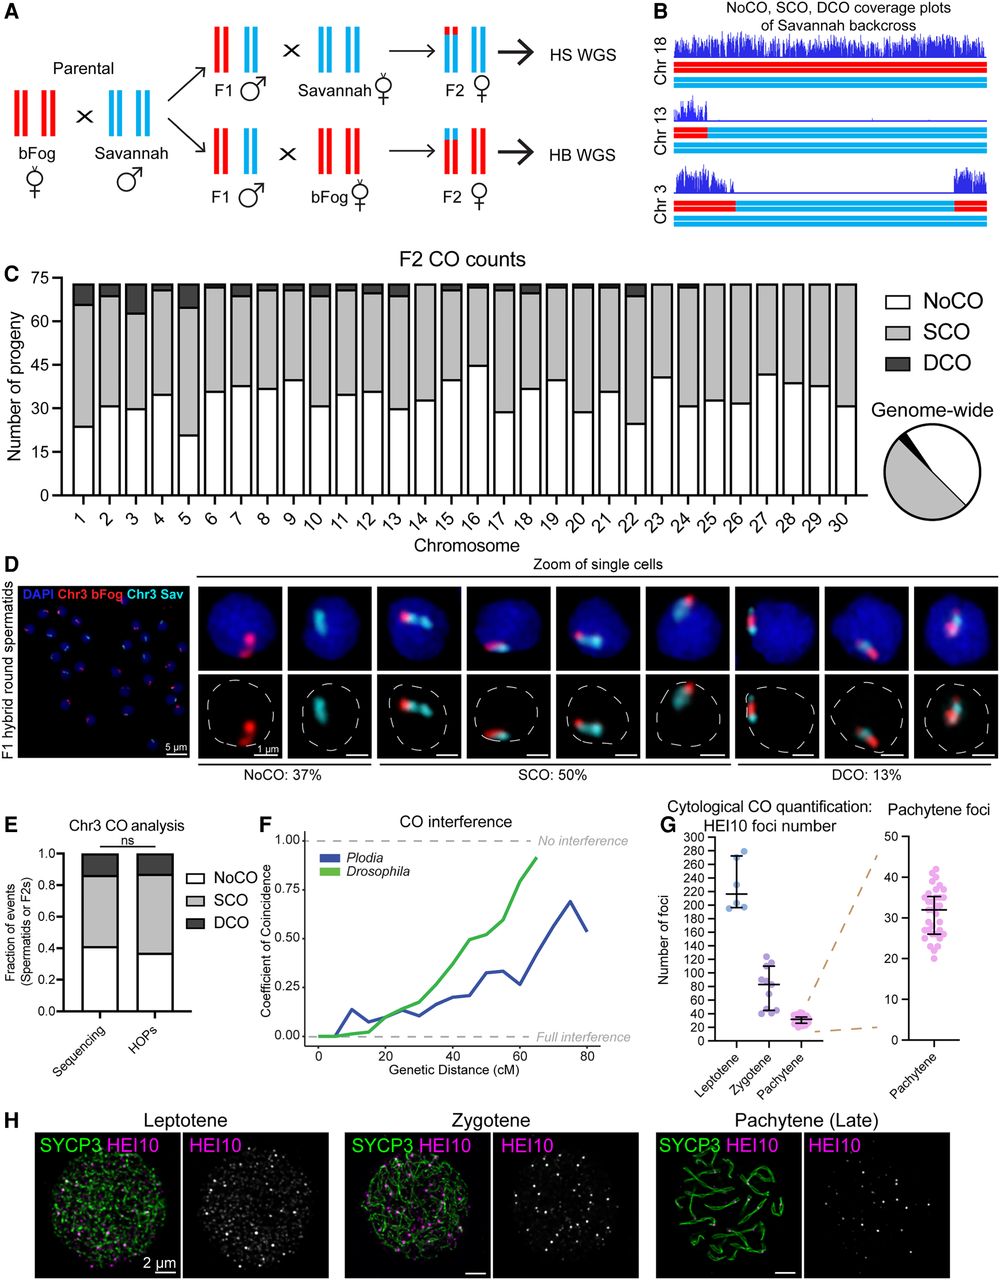
CO analysis in Plodia. (A) Schematic of crosses to generate hybrids for whole-genome sequencing. bFog chromosome is shown in red and Savannah chromosome in blue. (B) Representative coverage plots of Savannah backcrosses for three chromosomes to visualize CO(s). SNP coverage plots for Chr 18, 13, and 3 showing NoCO, SCO, and DCO, respectively. (Top) SNP density plot and (bottom) chromatids for each chromosome after CO showing chromosome regions from bFog (red) and Savannah (blue), as shown in A. (C) Bar graph showing F2 CO quantification in this study for each chromosomal location of CO chromatids identified in the F2s. NoCO is shown in white, SCO in gray, and DCO in black. (Bottom right) Pie chart showing genome-wide percentage of COs quantified in F2 hybrids. NoCO = 47%, SCO = 50%, and DCO = 3%. (D) Round spermatids labeled with HOPs, with the Savannah allele in cyan and the bFog allele in red. DAPI is shown in blue. (Left) Field of cells; (right) zoom of representative single cells showing NoCO, SCO, or DCO; and (below) quantification percentage for Chr 3 in round spermatids. (E) Quantification of COs present on Chr 3 in round spermatids by FISH compared with F2 sequencing. (F) Coefficient of coincidence (CoC; observed/expected DCO events) versus genetic distance for both Plodia (blue) and Drosophila (green). A CoC value of one indicates no CO interference. (G) Quantification of HEI10 foci number based on immunofluorescence in early prophase I cells from spermatocyte spreads. (Right) Zoom of HEI10 quantification at pachytene. (H) Representative images of HEI10 immunofluorescence in early prophase I cells (leptotene, zygotene, and pachytene).