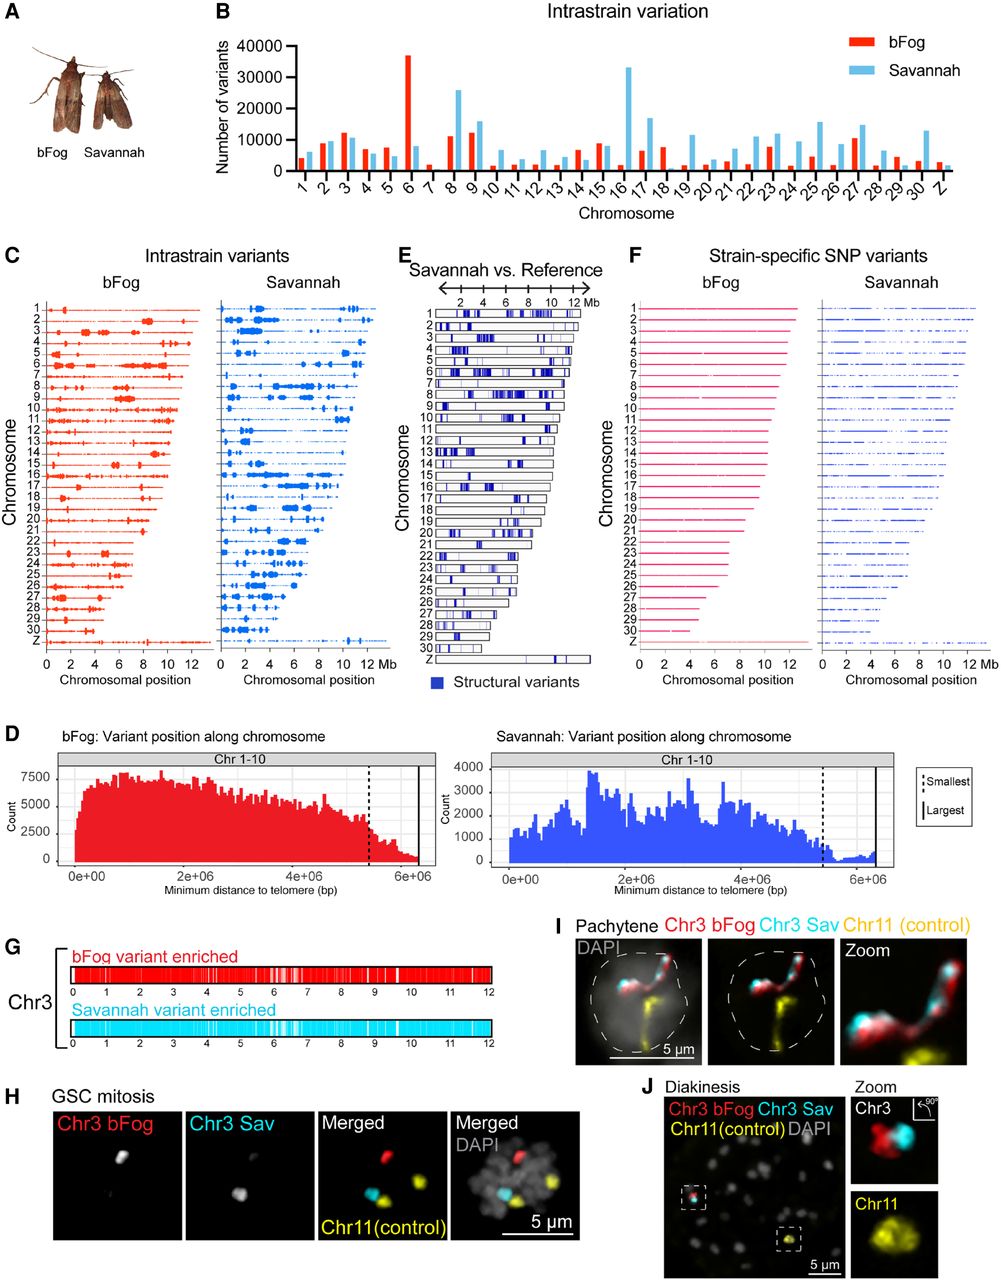
Genetic variation in Plodia strains. (A) Image of the adult female Plodia interpunctella strains used in this study: the bFog strain (left) and the Savannah strain (right). (B) Number of variants per chromosome between individuals in our bFog (red) and Savannah (blue) strains. The plot shows the count of variants across three WT individuals for each strain. An intrastrain variant is a single–base pair locus that is different between any of the individuals. (C) Plots showing the position and enrichment of intrastrain variants on individual chromosomes for the bFog strain (left) and Savannah strain (right). (D) Histogram showing the minimum distance of identified strain-specific variants from the end of a chromosome, in which the number of variants for each chromosome is binned using 30 kb windows. The genome was subdivided into three chromosome-sized groups, with Chr 1–10 (largest; 12.65–10.82 Mb) shown here. The “skewness” of variants toward the chromosome end is as follows for Chr 1–10: Savannah = 0.157 and bFog = 0.276. Dashed lines show the mid-point of the smallest chromosome per chromosome group, and solid lines show the mid-point of the largest chromosome per chromosome group. (E) Representative structural variants (blue) detected in the genome of our Savannah strain individuals compared with the reference Plodia Savannah genome. (F) Haplotype-specific variants per chromosome in the bFog (red) and Savannah (blue) strains. (G) Schematic of HOPs for Chr 3 designed based on variants detected in the whole-genome sequencing data. (H–J) Chr 3 HOPs FISH on mitotic germline stem cell (H), pachytene cell (I), and diakinesis cell (J) from male F1 hybrids testes squashes. DAPI is shown in gray, bFog Chr 3 in red, Savannah (Sav) Chr 3 in blue, and Chr 11 control in yellow.