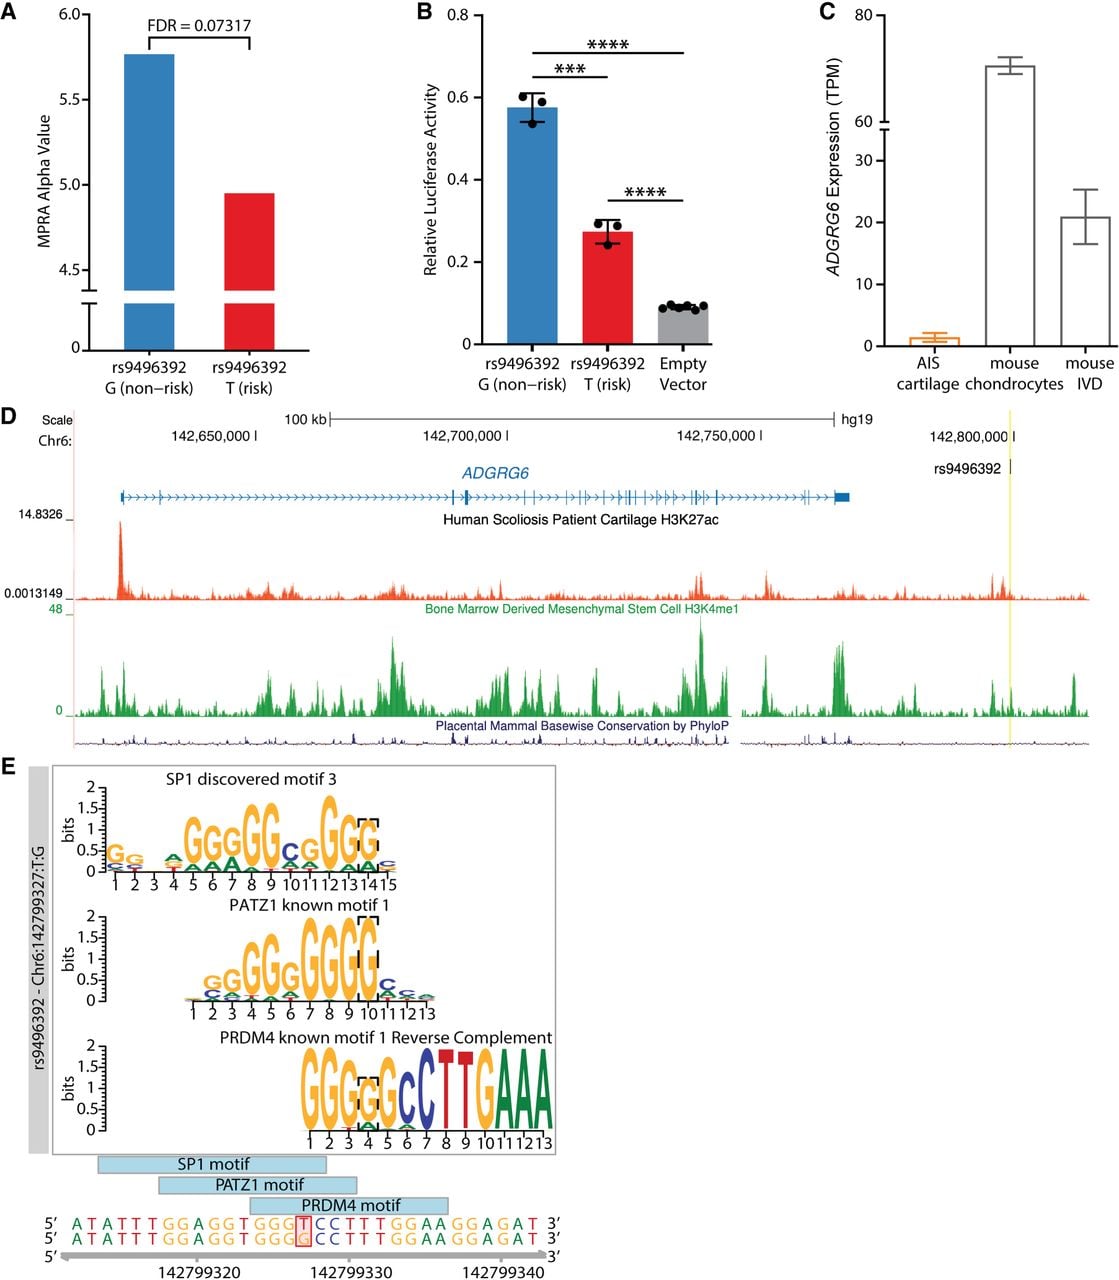
Predicted transcriptional disruption owing to variant rs9496392. (A) MPRA signal of rs9496392 CRS in TC28a2 (n = 3). The reported false-discovery rate (FDR) value is a FDR adjusted likelihood ratio test P-value of the difference in activity between alleles reported by MPRAnalyze. (B) Relative luciferase activity of the rs9496392 CRS in TC28a2 (n = 3). (***) P < 0.001; (****) P < 0.0001. The statistical significance between CRS activity and empty-vector negative controls was determined by one-way ANOVA; the statistical significance between SNP alleles was determined by unpaired Student's t-test. (C) Expression of ADGRG6 in AIS spinal cartilage, mouse chondrocytes, and mouse intervertebral disc. (D) Scoliosis H3K27ac ChIP-seq (red) and mesenchymal stem cell–derived chondrocyte H3K4me1 (green) enrichment at the rs9496392 enhancer (highlighted in yellow). (E) Predicted disruption of transcription factor binding motifs. Error bars indicate mean ± SD.