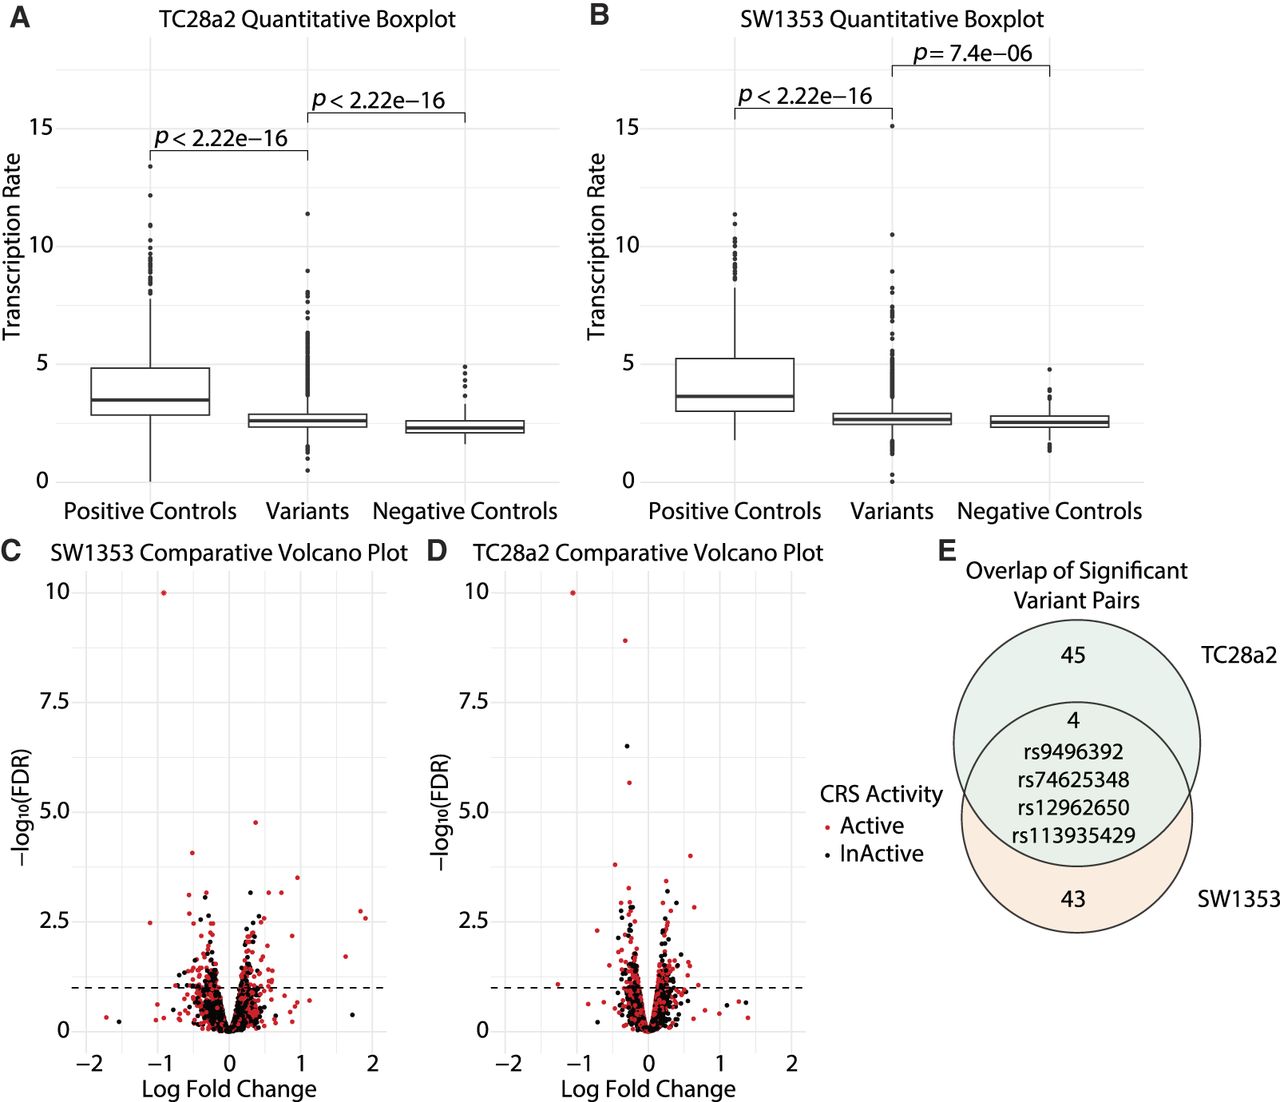
Quantitative and comparative MPRA results. (A,B) Boxplots showcasing the quantitative analysis performed on the RNA/DNA transcription rate for all CRSs, separated into positive controls, negative controls, and combined reference and alternate allele (variants). P-values at the top of the boxplots were calculated using the Wilcoxon rank-sum test comparing the median transcription rate between the two conditions listed under the bracket. A separate P-value calculation is done by MPRAnalyze to determine individual CRSs that are active compared to the negative controls (Methods). (C,D) Volcano plots showing the comparative analysis performed by MPRAnalyze on the reference alternate variant pairs. Each point is a single reference/alternate variant pair, positioned based on the comparative analysis and colored based on the quantitative analysis. The x-axis denotes the natural log fold change values of the CRS; a positive LFC indicates a higher transcription rate in the reference allele compared with the alternate allele. The y-axis denotes the –log10 of the FDR value that is associated with the variant pair's log fold change. A variant pair is called as significantly disruptive if the FDR value is less than 0.10, denoted by the dashed line. Additionally, we call a final significantly disruptive variant pair list as those that are both significantly disruptive, above the dashed line, and with either the reference or alternate allele significantly active compared with the negative controls (denoted as red). (E) Overlap of the final significant observed alternate allele variant pairs identified in the two cell lines.