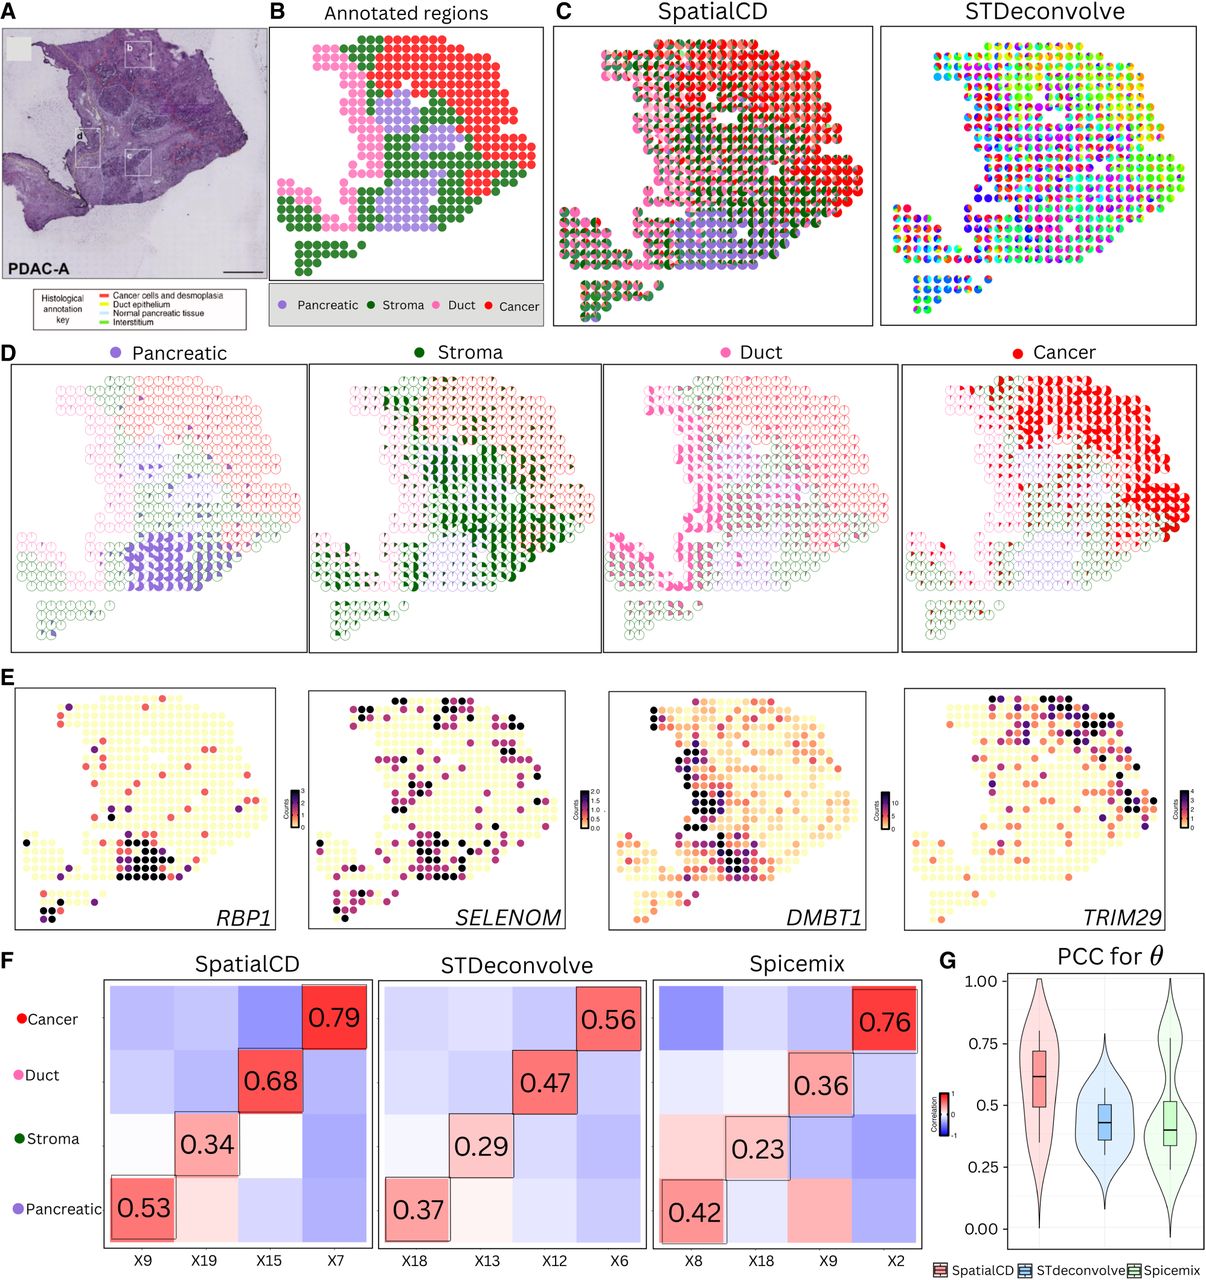
Deconvolution of real ST data (PDAC). (A) Histology staining image of human pancreatic ductal adenocarcinoma (PDAC) tissue. (B) Visualization of annotated regions defined by histologists from the original study. (C) Proportions of deconvolved cell types from SpatialCD and STdeconvolve represented as pie charts for each spot. (D) Highlights of identified deconvolved cell types from SpatialCD across annotated regions. (E) Gene counts of the top differentially upregulated gene for each deconvolved cell type corresponding to the annotated regions. (F) Comparison of cell-type composition (θ): Pearson’s correlation heatmaps between deconvolved and ground truth proportions using SpatialCD, STdeconvolve, and Spicemix, with matched deconvolved and ground truth cell types highlighted with bounding boxes. (G) PCC for θ: Pearson’s correlation coefficients between deconvolved cell-type compositions and matched ground truth across spots for SpatialCD, STdeconvolve, and Spicemix.