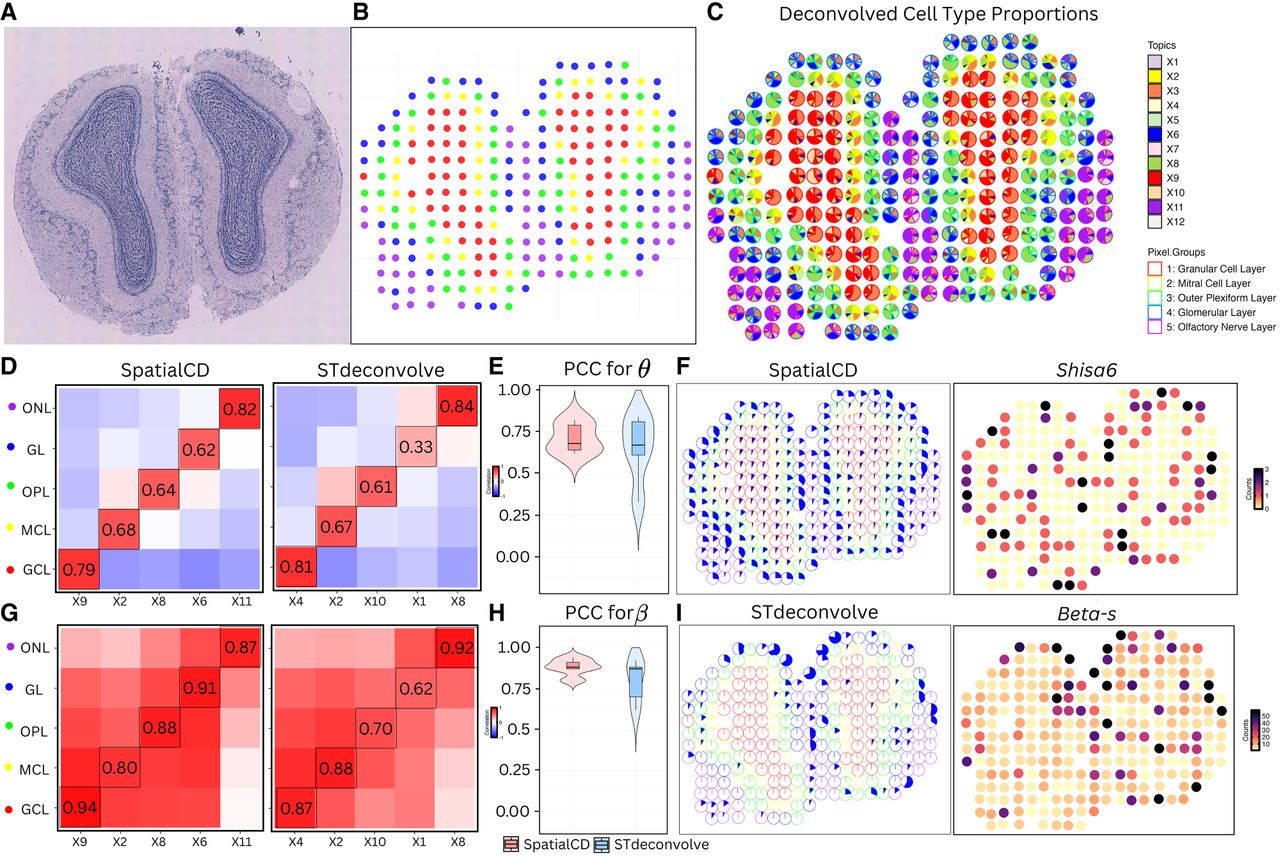
Deconvolution of real ST data (MOB). (A) Histology staining image of the mouse main olfactory bulb (MOB) tissue. (B) Visualization of spots colored by their transcriptional cluster memberships overlaid on pixel spatial coordinates. (C) Proportions of deconvolved cell types from SpatialCD represented as pie charts for each spot. Spots are outlined with colors based on the pixel transcriptional cluster assignment corresponding to MOB coarse cell layers. (D) Comparison of cell-type composition (θ): Pearson’s correlation heatmaps between deconvolved and ground truth proportions using SpatialCD and STdeconvolve, with matched cell types highlighted with bounding boxes. (E) PCC for θ: Pearson’s correlation coefficients between deconvolved cell-type compositions and matched ground truth across spots for SpatialCD and STdeconvolve. (F) Highlights of the identified deconvolved cell type from SpatialCD (X6) in the glomerular layer (GL) and the corresponding gene counts of its most frequently expressed gene. (G) Comparison of transcriptional profile (β): Pearson’s correlation heatmaps between deconvolved and ground truth gene expression profiles using SpatialCD and STdeconvolve, with matched cell types highlighted. (H) PCC for β: Pearson’s correlation coefficients between deconvolved transcriptional profiles and matched ground truth profiles across genes for SpatialCD, STdeconvolve, and Spicemix. (I) Highlights of the identified deconvolved cell type from STdeconvolve (X1) in the GL and its most frequent gene. Abbreviations: GCL – Granular Cell Layer; MCL – Mitral Cell Layer; OPL – Outer Plexiform Layer; GL – Glomerular Layer; ONL – Olfactory Nerve Layer.