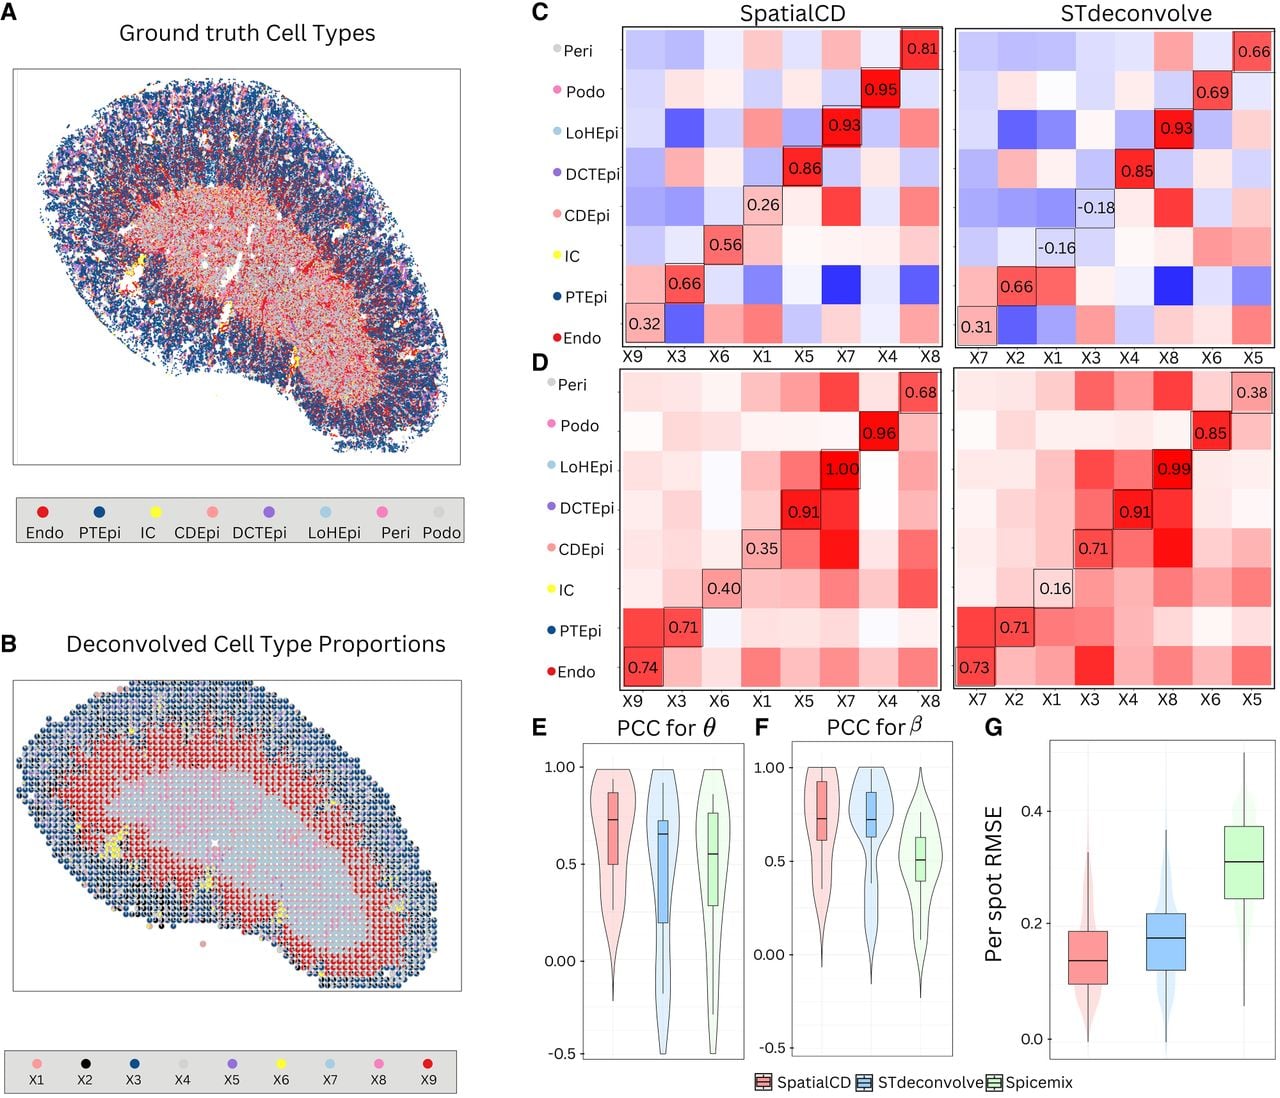
Deconvolution of simulated ST data (MK). (A) Ground truth single-cell resolution MERFISH data in mouse kidney. (B) Proportions of deconvolved cell types from SpatialCD represented as pie charts for each simulated spot. (C) Comparison of cell-type composition (θ): Pearson’s correlation heatmaps between deconvolved and ground truth proportions using SpatialCD and STdeconvolve, with matched deconvolved and ground truth cell types highlighted with bounding boxes. (D) Comparison of transcriptional profile (β): Pearson’s correlation heatmaps between deconvolved and ground truth gene expression profiles using SpatialCD and STdeconvolve, with matched deconvolved and ground truth cell types highlighted. (E) PCC for θ: Pearson’s correlation coefficients between the deconvolved cell-type composition and matched ground truth cell types across spots for SpatialCD, STdeconvolve, and Spicemix. (F) PCC for β: Pearson’s correlation coefficients between the deconvolved transcriptional profiles and matched ground truth profiles across genes for SpatialCD, STdeconvolve, and Spicemix. (G) Root-mean-square error (RMSE) per spot of the deconvolved cell-type proportions compared to ground truth for SpatialCD, STdeconvolve, and Spicemix. Abbreviations: Endo – endothelial cell; PTEpi – proximal tubule epithelial cell; IC – immune cell; CDEpi – collecting duct epithelial cell; DCTEpi – distal convoluted tubule epithelial cell; LoHEpi – loop of Henle epithelial cell; Peri – pericyte; Podo – podocyte.