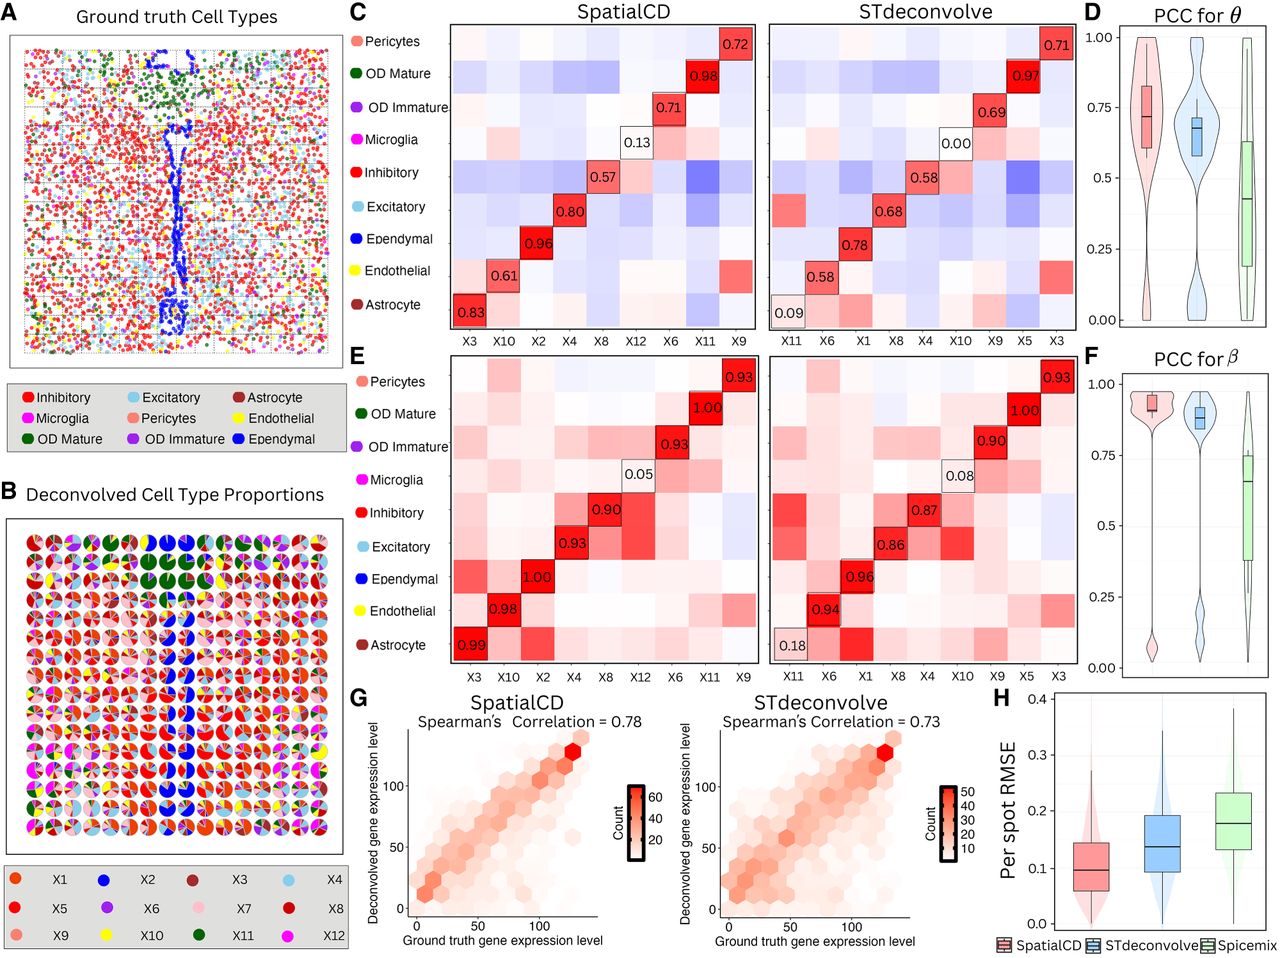
Deconvolution of simulated ST data (MPOA). (A) Ground truth single-cell resolution MERFISH data of one section of the MPOA, partitioned into 100 μm2 grids (gray squares). Each dot is a single cell colored by its ground truth cell-type label. (B) Proportions of deconvolved cell types from SpatialCD represented as pie charts for each simulated spot. (C) Comparison of cell-type composition (θ): Pearson’s correlation heatmaps between deconvolved and ground truth proportions using SpatialCD and STdeconvolve, with matched deconvolved and ground truth cell types highlighted with bounding boxes. (D) PCC for θ: Pearson’s correlation coefficients between the deconvolved cell-type composition and matched ground truth across spots for SpatialCD, STdeconvolve, and Spicemix. (E) Comparison of transcriptional profile (β): Pearson’s correlation heatmaps between deconvolved and ground truth gene expression profiles using SpatialCD and STdeconvolve, with matched deconvolved and ground truth cell types highlighted. (F) PCC for β: Pearson’s correlation coefficients between the deconvolved transcriptional profiles and matched ground truth profiles across genes for SpatialCD, STdeconvolve, and Spicemix. (G) Gene ranking based on expression levels in deconvolved transcriptional profiles compared to their rankings in the matched ground truth, along with the corresponding Spearman's correlation. (H) Boxplot of the root-mean-square error (RMSE) per spot of the deconvolved cell-type proportions compared to ground truth for SpatialCD, STdeconvolve, and Spicemix.