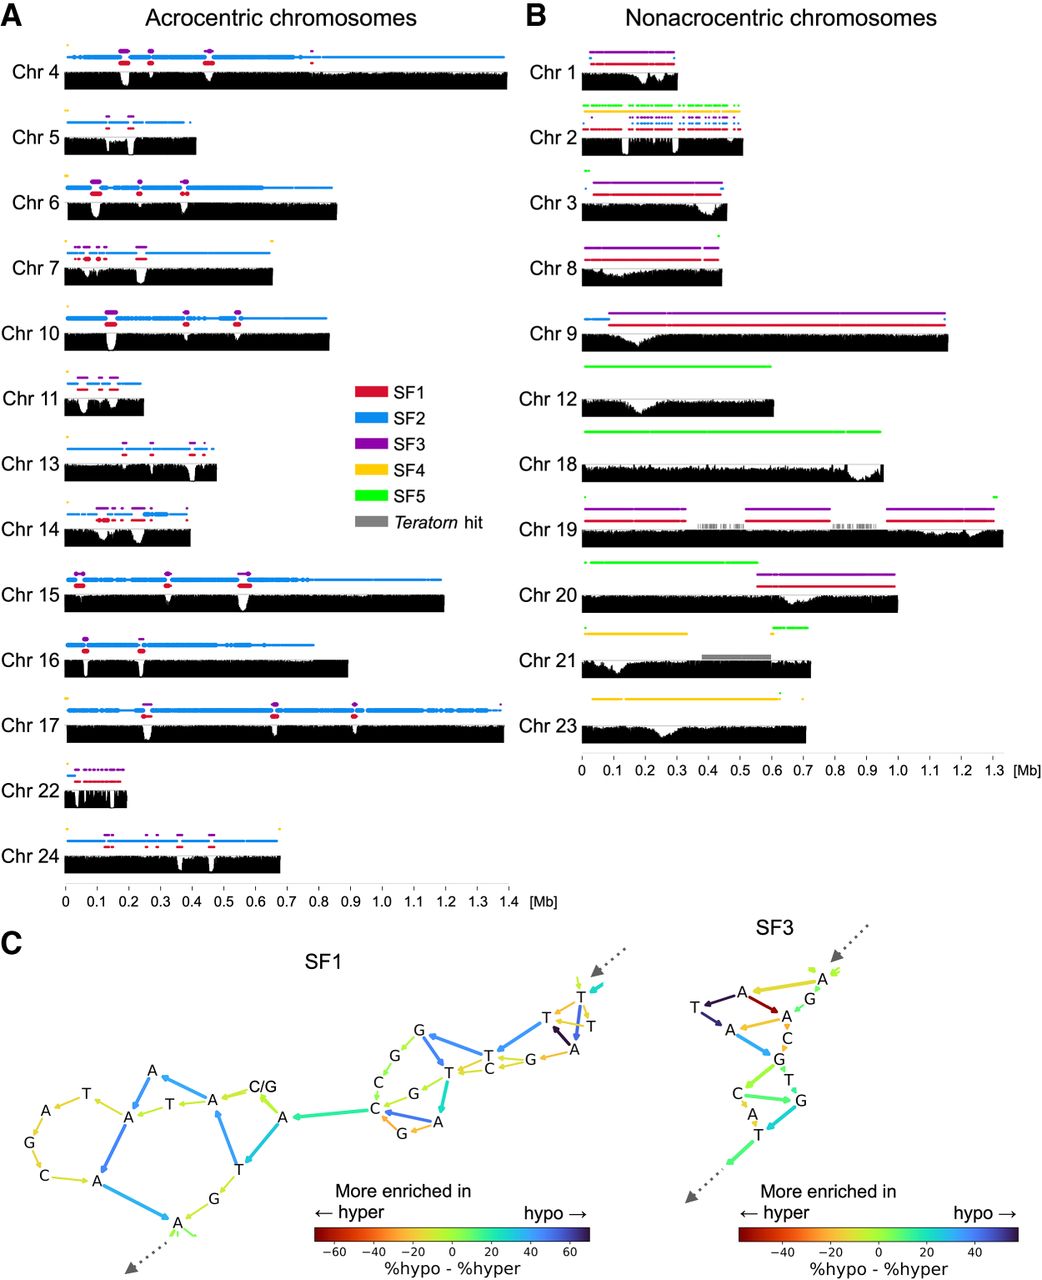
Positional landscape of sequence and CpG methylation status of centromeric satellites in the complete Hd-rR genome. (A,B) Positional distributions of centromeric monomers colored by SF group, along with average ONT-inferred CpG methylation levels from zero to 100, for acrocentric (A) and nonacrocentric (B) chromosomes of the T2T Hd-rR assembly. Thick lines indicate ICUC monomers. For HNI and HSOK, see Supplemental Figures S12 and S13. (C) Graph representations of representative monomers for SF1 and SF3, for which monomer sequences were progressively aligned and sequence variations appear as branching paths, shown around the sequence motifs enriched in putatively hypomethylated monomers. Edges are colored by relative enrichment in hypo- and hypermethylated monomers.