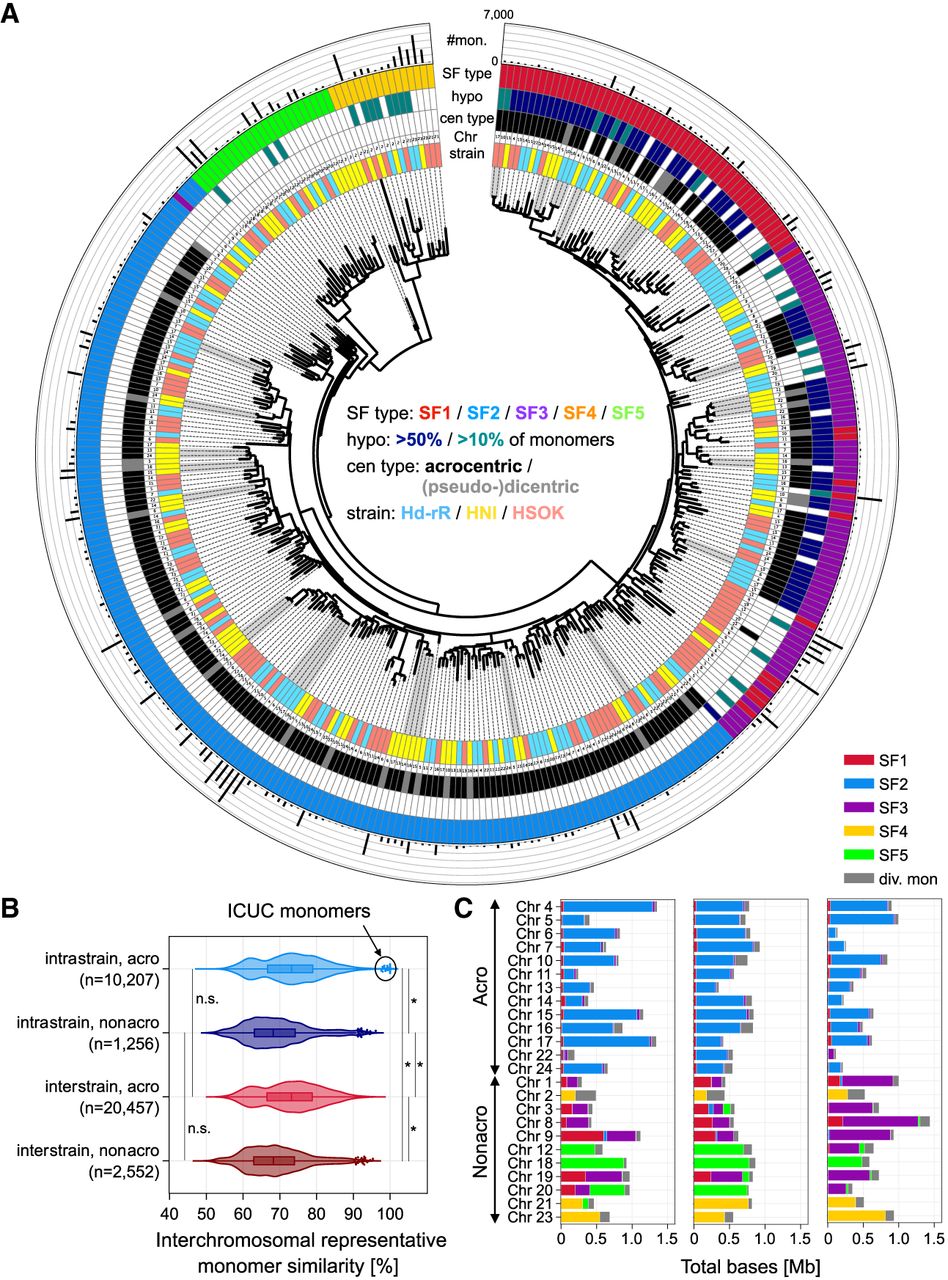
Compositional and phylogenetic landscape of centromeric satellites. (A) Phylogenetic tree of 350 representative monomers excluding divergent monomers. The outermost track is the monomer count per representative, and the “hypo” track indicates ONT-inferred CpG hypomethylation level (i.e., the proportion of hypomethylated monomers within each representative). Dark gray shades on the dotted lines connecting the tree leaves and the strain track indicate interchromosomal ultraconserved (ICUC) monomers. (B) Pairwise interchromosomal monomer sequence similarities for four categories by two aspects: intra- versus interstrain, and within acrocentric versus nonacrocentric chromosomes. Wilcoxon test; (*) P < 1.0 × 10−50, (n.s.) P > 0.01. (C) Centromeric satellite array lengths by chromosome and SF group. Acrocentric chromosomes are placed on the upper side and nonacrocentric chromosomes on the lower side.