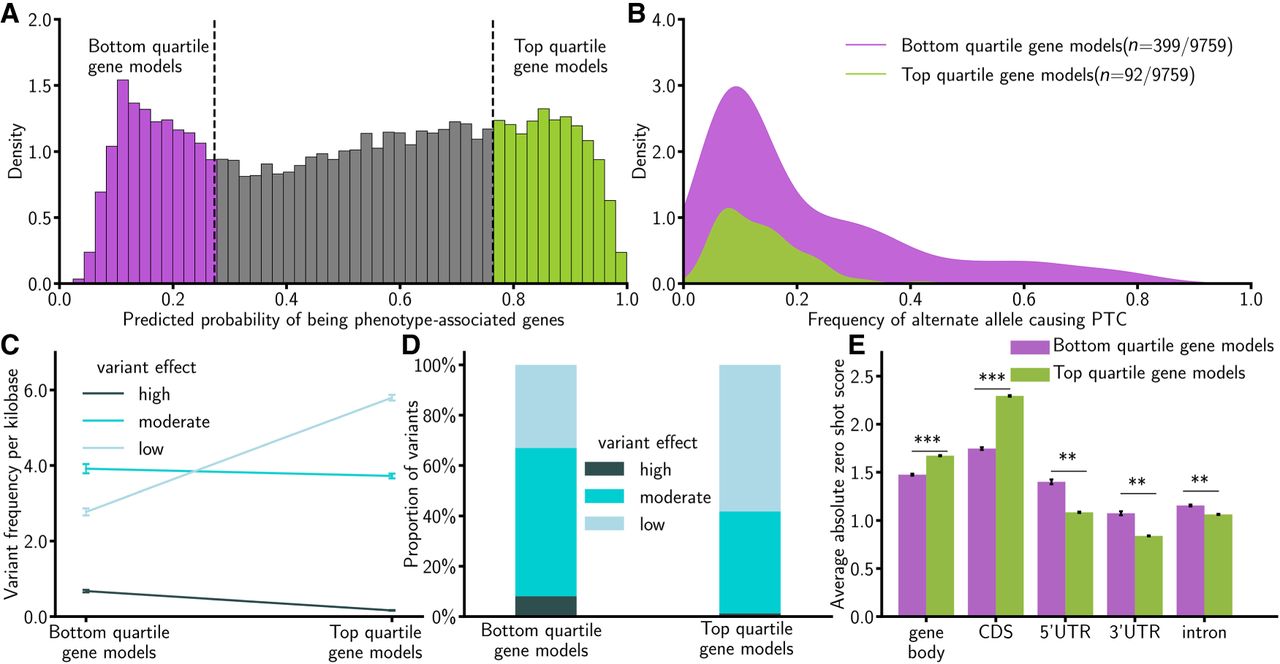
Genes with higher estimated effects on plant phenotypes are conserved in the maize population. (A) Bottom- and top-quartile gene models were defined from the predicted probability distribution derived from the model trained with the top 100 genomic sequence–derived and evolutionary features. (B) The bottom-quartile gene models show approximately 4.4-fold higher odds of containing premature stop codons compared with the top-quartile models (P-value < 2.26 × 10⁻¹⁶, Fisher's exact test). (C) Variant frequency per kilobase in coding sequences of the primary transcript of the gene models, separated by effect type. Bottom-quartile models have higher frequencies of high-effect (P-value = 9.03 × 10⁻³³) and moderate-effect variants (P-value = 0), whereas top-quartile models have higher frequencies of low-effect variants (P-value = 0; two-tailed Mann–Whitney U test). (D) Proportional distribution of high-, moderate-, and low-effect variants between quartiles. (E) Average absolute zero-shot score for variants estimated from a pretrained DNA language model, PlantCaduceus (Zhai et al. 2025), in different parts of the gene models between the bottom-quartile gene models and top-quartile gene models from A. (**) 0.01 < P-value < 1 × 10⁻²⁰, (***) P-value < 1 × 10−200 (two-tailed Mann–Whitney U test).