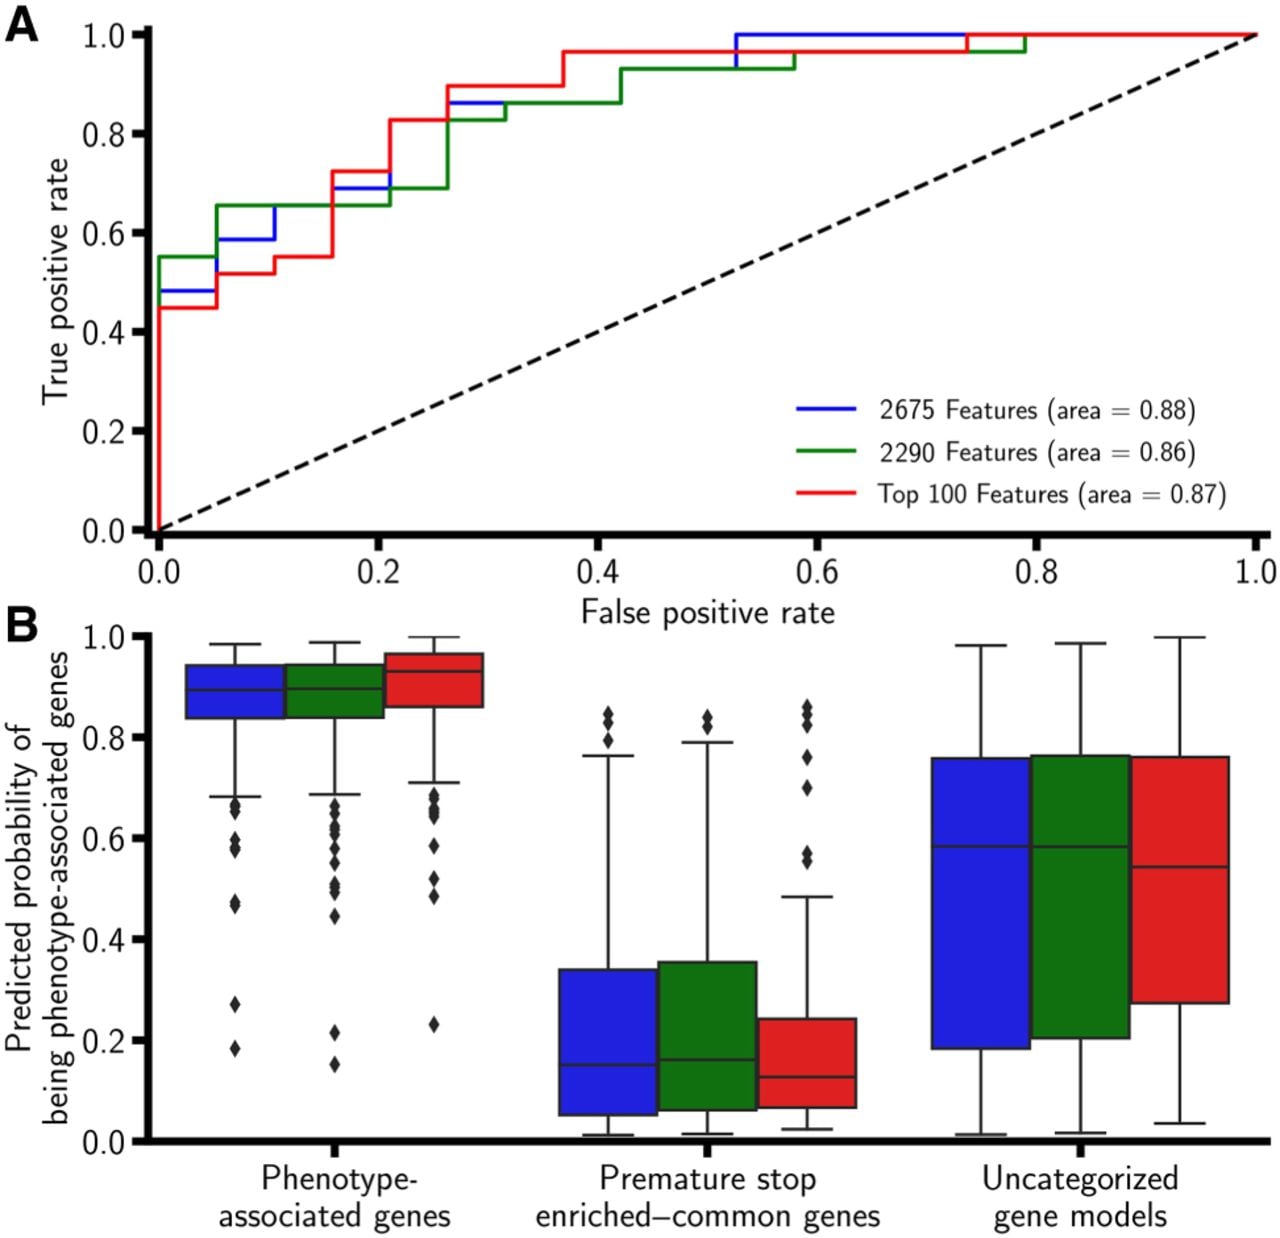
Figure 2.
Model performance using different subsets of total features. (A) ROC curves are generated from three models: one using all 2675 features (nongenomic, genomic sequence–derived, and evolutionary), one using 2290 genomic sequence–derived and evolutionary features, and one using the top 100 genomic sequence–derived and evolutionary features. Performance was evaluated on 48 withheld gene models. (B) Predicted probability from the three models in A across all maize gene models.