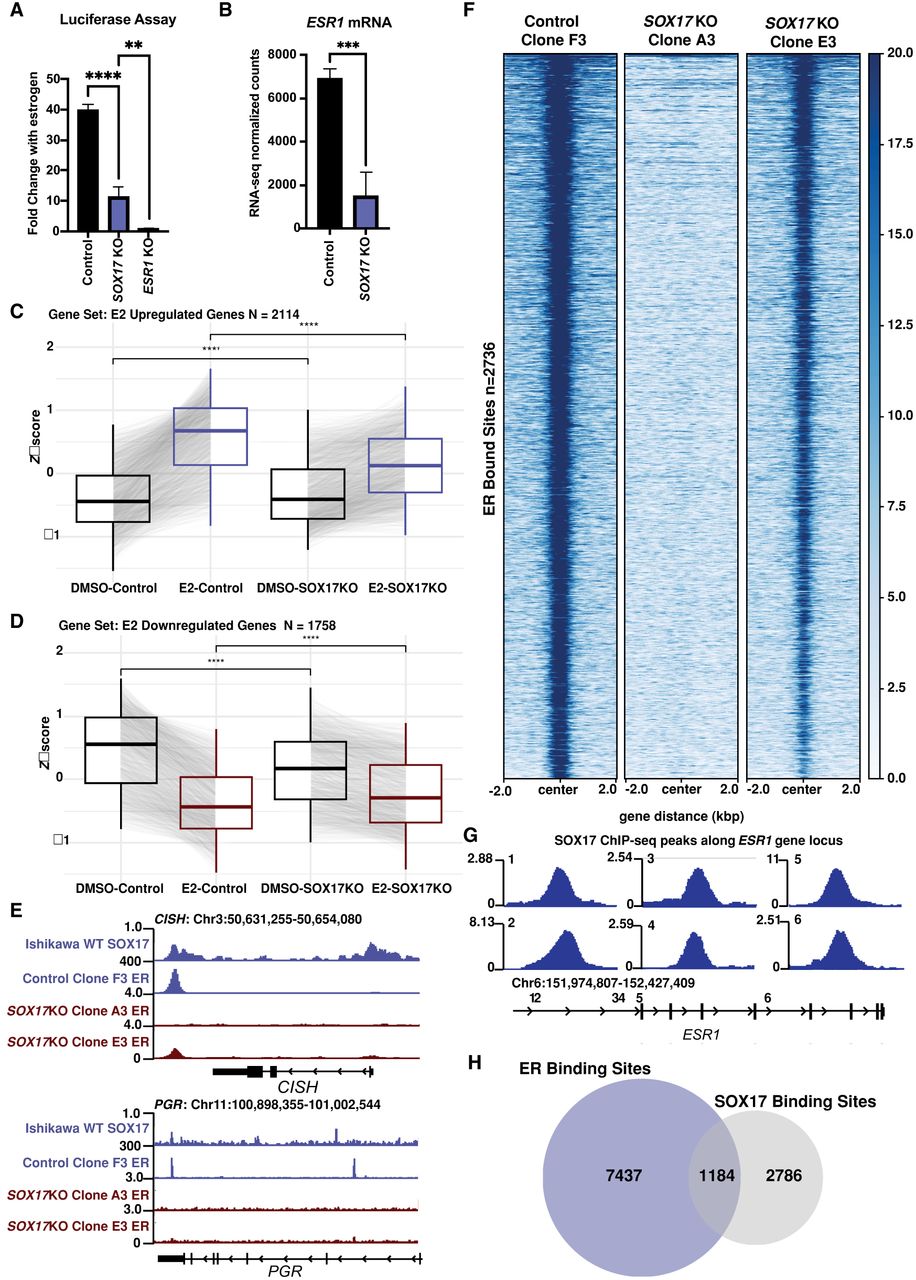
SOX17 KO decreases ER activity. (A) Bar chart shows ERE luciferase reporter activity relative to no estrogen treatment in SOX17 KO lines compared with a control and an ESR1 KO line. (B) Bar graph shows decreased ESR1 mRNA normalized counts in SOX17 KO lines compared with a control. (C,D) Aggregate plots show Z-scores comparing DMSO-treated and estrogen (E2)-treated samples from the RNA-seq data for SOX17 KO lines and control lines for E2 upregulated genes (C) and E2 downregulated genes (D). (E) Browser track shows decreased ER binding at estrogen-responsive genes CISH and PGR. (F) Heatmap shows decreased ER genomic binding signal in SOX17 KO lines compared with control lines across all ER bound sites. (G) Browser track shows six SOX17 binding sites near ESR1 gene locus. (H) Venn diagram shows overlap of binding sites between ER and SOX17 in parental Ishikawa cells.