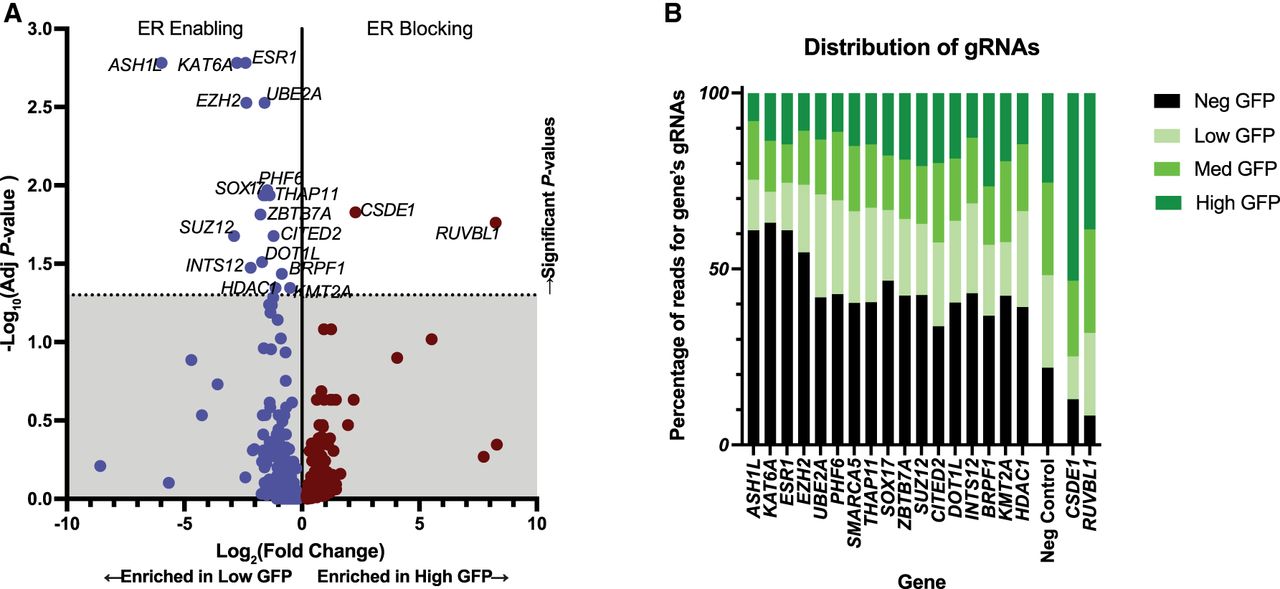
Figure 5.
CRISPR KO screen identifies important genes for ER activity in Ishikawa cells. (A) Volcano plot shows the ER-enabling and ER-blocking genes with their log2 fold changes and adjusted P-values. (B) Stacked bar plot shows the gRNA counts for each significant gene in the four GFP bins. The gRNAs for the ER-enabling genes are enriched in the negative GFP bin (black), and the gRNAs for the ER-blocking genes are enriched in the high GFP bin (darkest green).