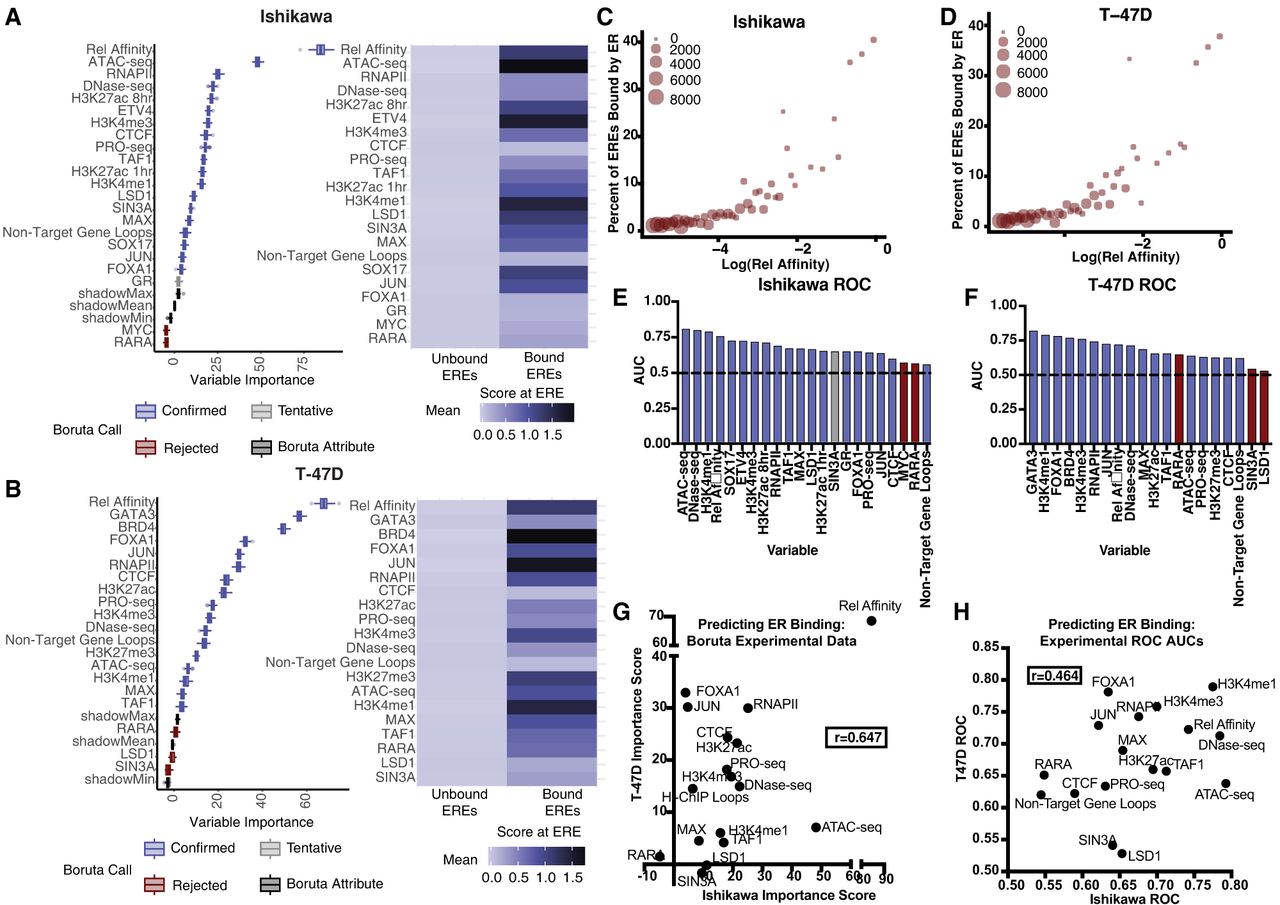
Bound EREs are predicted by sequence, chromatin accessibility, histone modifications, and cell line–specific transcription factors. (A,B) Boxplots show the ranked factor importance for predicting bound EREs by Boruta for Ishikawa (A, left) and T-47D (B, left). Colors indicate Boruta determination of importance; blue is confirmed, light gray is tentative, red is rejected, and dark gray is a Boruta attribute. Heatmaps show the normalized average value of each factor at bound and unbound EREs for Ishikawa (A, right) and T-47D (B, right). (C,D) Scatter plots show the relationship between the log of relative affinity for ER of an ERE and the percentage of EREs bound by ER for Ishikawa (C) and T-47D (D). (E,F) Bar charts show the ROC AUC of each factor individually in predicting bound EREs in Ishikawa (E) and T-47D (F). Bar colors correspond with Boruta determination of importance. The dotted line shows the value 0.5, indicating an ROC AUC from random prediction. (G) Scatter plot shows the comparison of Boruta importance scores in predicting bound EREs between cell lines from the experimental data, with a Pearson correlation coefficient of 0.647. (H) Scatter plots show the comparison of ROC AUCs in predicting bound EREs between cell lines from the experimental data set, with a Pearson correlation coefficient of 0.464.