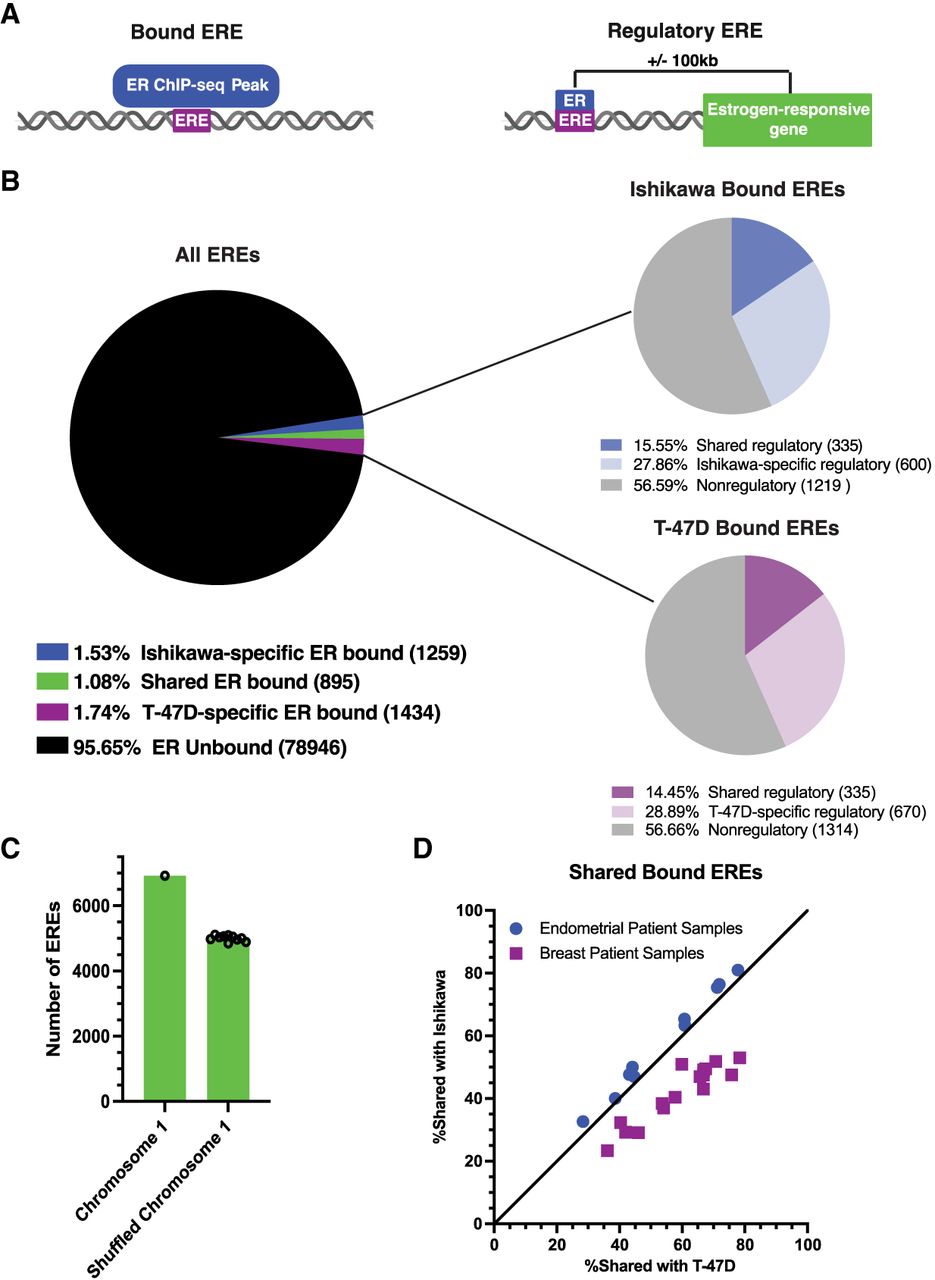
Most EREs are unbound by ER and do not affect gene expression. (A) Illustration shows the definition of bound EREs (left) and regulatory EREs (right). (B) Pie chart on the left shows the number of EREs that are bound in both cell lines, are bound only in Ishikawa, are bound only in T-47D, and are unbound. Pie charts on the right show, out of the EREs that are bound in Ishikawa (top) and T-47D (bottom), the number of regulatory EREs unique to that cell line, regulatory EREs shared between cell lines, and nonregulatory EREs. (C) Bar chart shows the number of EREs found in Chromosome 1 compared with the number of EREs in 10 different random shufflings of Chromosome 1. (D) Scatter plot displays the percentage of bound EREs shared with the Ishikawa cell line (y-axis) and with the T-47D cell line (x-axis) from endometrial cancer patient samples (blue circles) and breast cancer patient samples (purple squares). All patient samples share more bound EREs with their corresponding cell line than with their noncorresponding cell line.