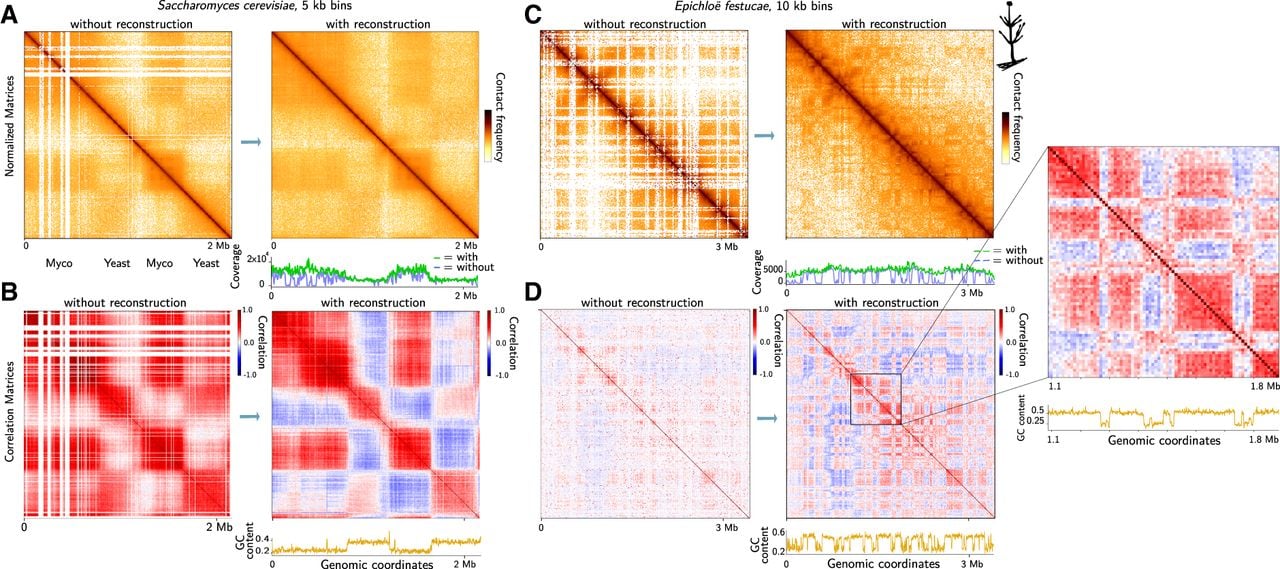
Compartment reconstruction signals by Hicberg. (A) Normalized contact map of the chimeric Chromosome XVI of S. cerevisiae and M. mycoides binned at 5 kb resolution without and with Hicberg reconstruction. The GC content of the sequences and annotations for S. cerevisiae and M. mycoides are shown below the left panel, and the Hi-C coverages before (blue) and after (green) the Hicberg reconstructions are shown below the right panel. (B) Correlation matrices of the chimeric Chromosome XVI of S. cerevisiae and M. mycoides binned at 5 kb resolution without and with reconstruction. The GC content is shown below the map on the right. (C) Normalized contact map of Chromosome 5 of Epichloë festucae binned at 10 kb resolution without and with reconstruction. Hi-C coverages before (blue) and after (green) Hicberg reconstruction are shown below the right panel. (D) Correlation matrices of Chromosome 5 of E. festucae binned at 10 kb resolution without and with reconstruction. The GC content (orange) is shown below the map on the right. A zoom-in of the contact map is shown in relation to the GC content signal below.