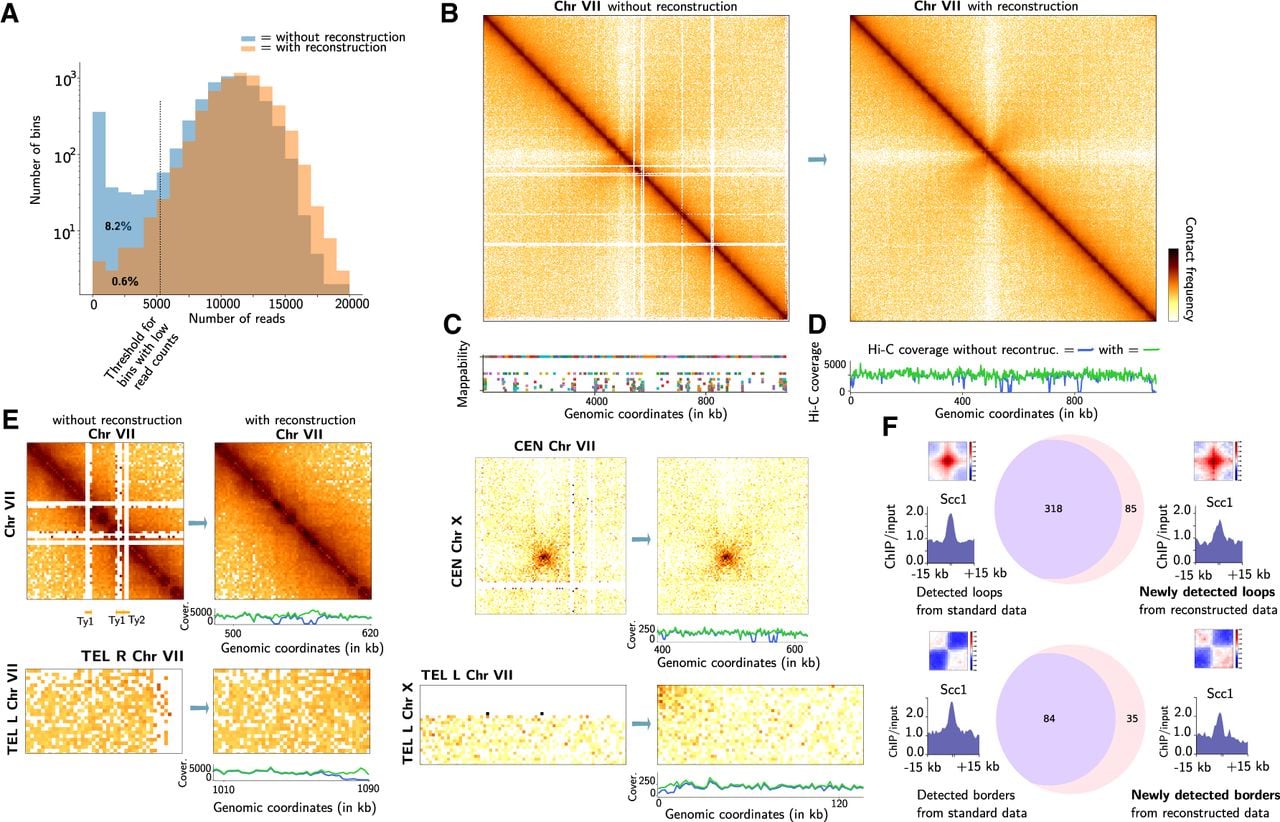
Examples of Hicberg reconstructions in the genome of the model organism S. cerevisiae. (A) Distribution of the number of reads per bin for standard Hi-C experiment in yeast S. cerevisiae without and with Hicberg reconstruction. The threshold used to filter bins with few reads before normalization corresponds to five median absolute deviations below the median log marginal sum and is represented by a dashed line. (B) Chromosome contact map without and with Hicberg reconstruction for Chromosome VII (bin = 2 kb, with normalization) (C) Mappability signal along the Chromosome VII. (D) Hi-C coverage before (green) and after (blue) Hicberg reconstruction. (E) Examples of reconstructions at representative regions: on several yeast transposons (Ty) at Chr VII, between both telomeres TEL-L and TEL-R of Chr VII, between centromeres of Chr VII and Chr X, and between telomeres TEL-L of Chr VII and TEL-L of Chr X with Hi-C coverages without and with reconstruction. (F) Detection of chromosomal loops and borders on data without and with reconstruction. Pileup plots for detected loops and borders for both types of data are shown as well as average signal around anchors of ChIP-seq signal of Scc1, a cohesin subunit.