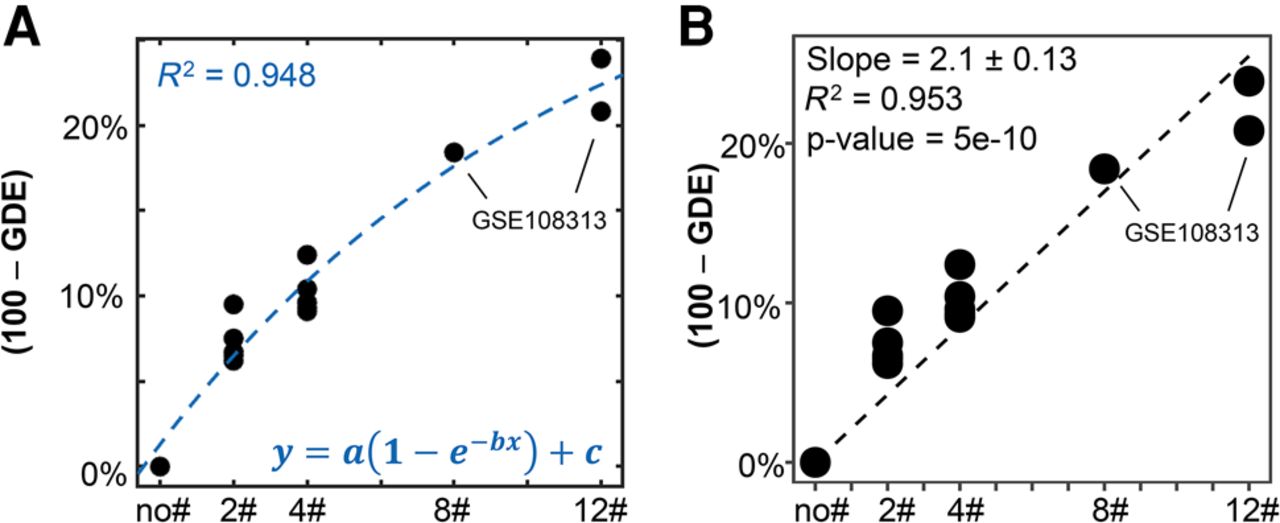
Statistical modeling of hashtag demultiplexing: (A) The difference between GDE and 100 (as percentages) is plotted on y-axis for different pools and the number of hashtags in respective pools in the x-axis, from the current data set and another external data set (GSE108313). Nonlinear regression analysis was carried out using the exponential decay model (the increasing form, equation at the bottom) on the data set. The blue dashed line represents the best fit nonlinear model. R2 of nonlinear regression is mentioned at the left top. The estimated values of the parameters a, b, and c with 95% CI are as follows: a = 32.6 (14.53, 50.68), b = 0.08661 (− 0.001616, 0.1748), c = 1.3 (− 1.477, 4.077). (B) Linear regression on the same data as in A. The dashed line is the best-fit linear model. Slope, P-value, and R2 of linear regression on the data points are recorded at the left top.