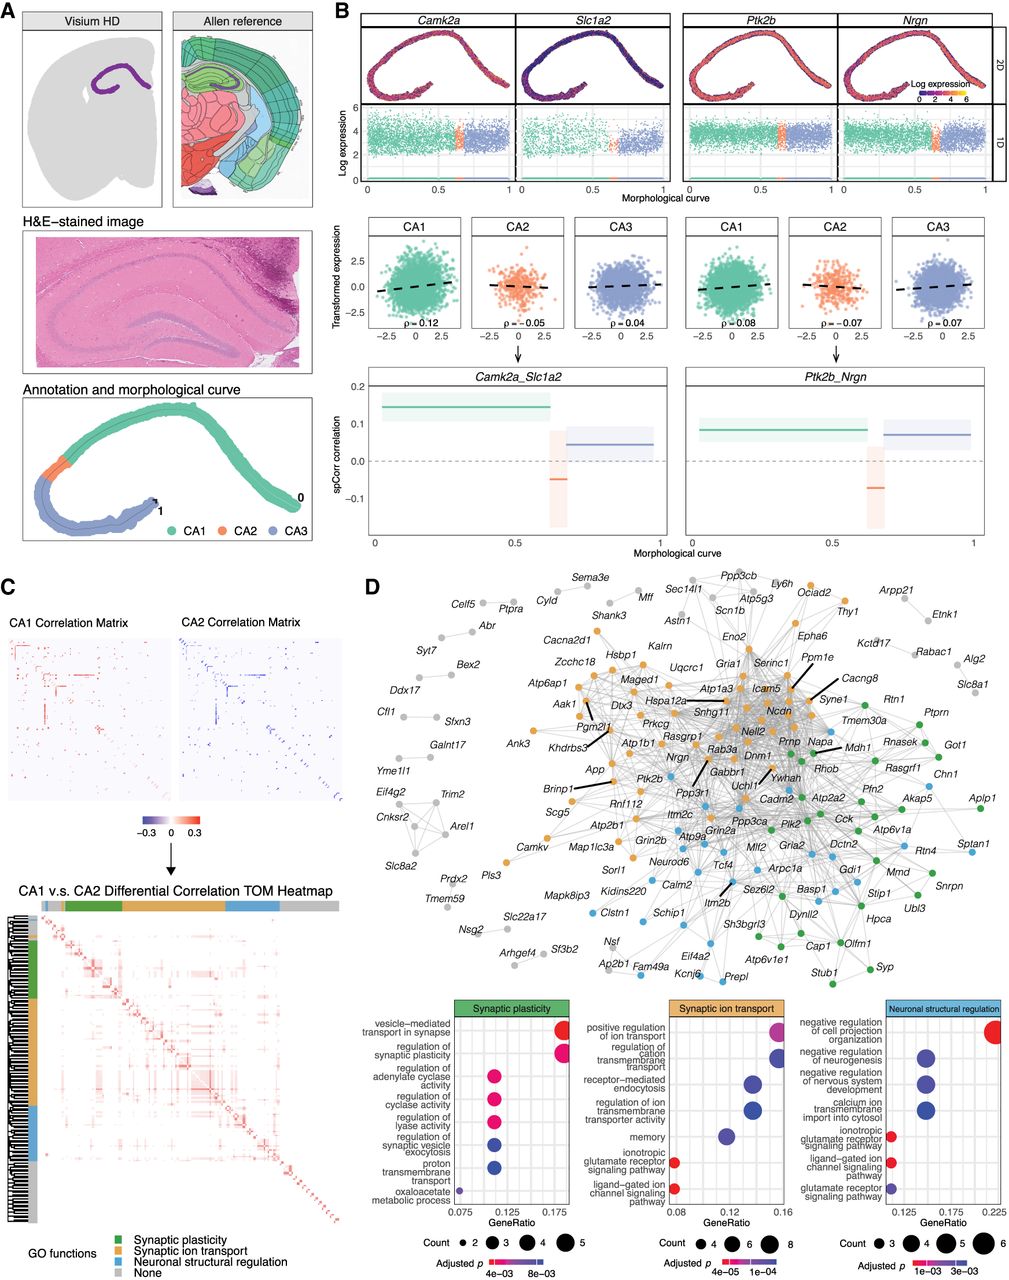
spCorr discovers biologically relevant correlation shift between spatial domains. (A) Data preprocessing of the Visium HD mouse brain ST data set. Top: spatial segmentation from BANKSY identifying two adjacent domains corresponding to the pyramidal layer of the hippocampus (aligned with CA1sp-CA3sp regions in the Allen Mouse Brain Atlas). Middle: H&E-stained image of the selected hippocampal region. Bottom: spatial annotation based on CA2 marker gene expression and one-dimensional spatial curve fitted by MorphoGAM along the CA1-CA3 axis. (B) Local correlation estimation for representative gene pairs. Top: Log-transformed expression levels of Camk2a, Slc1a2, Ptk2b, and Nrgn. Middle: Scatter plot of the transformed gene expressions after marginal distribution modeling and Gaussian transformation. The black dashed lines indicate ordinary least squares (OLS) regression fits to the scatter plots and are shown for visualization only; the value of ρ displayed in the plot corresponds to the OLS-estimated correlation. Bottom: spCorr-inferred spot-level correlation estimates for each gene pair, with 95% confidence intervals, modeled using discrete spatial domain annotations and visualized along the spatial curve. (C) Differential correlation (DC) analysis between CA1 and CA2. Top: Heatmaps of estimated correlation matrices for significantly DC gene pairs, showing broad downregulation in CA2. Bottom: Hierarchical clustering of the differential correlation matrix identified four gene modules enriched for distinct neuronal processes. (D) Network and functional interpretation of DC results. Top: DC network visualization for gene pairs with statistically significant correlation shifts between CA1 and CA2. Bottom: GO function plot for three representative modules, highlighting synaptic plasticity, synaptic ion signaling, and neuronal structural regulation, which are biological processes known to differ between CA1 and CA2.