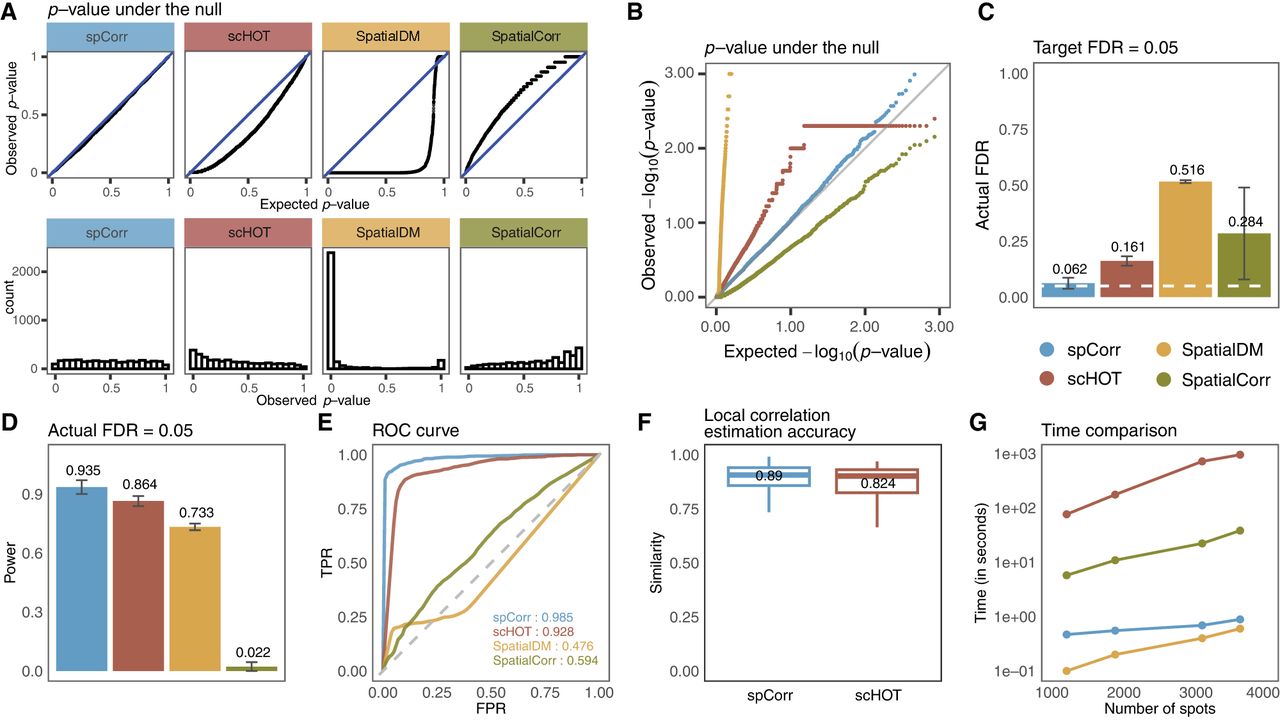
spCorr achieves reliable FDR control, high statistical power, estimation accuracy, and computational efficiency in simulation studies. (A) Distributions of observed p-values for non-SVC gene pairs across four methods: spCorr, scHOT, SpatialDM, and SpatialCorr. Top: quantile-quantile plots comparing observed p-value quantiles to the expected Uniform[0,1] distribution. Bottom: histograms of observed p-values. spCorr exhibits the closest adherence to the expected Uniform[0,1] distribution, indicating well-calibrated p-values. (B) Quantile-quantile plots of the same p-values as in A on scale. (C) Actual FDRs achieved by each method under a target FDR of 0.05 (Benjamini–Hochberg adjusted p ≤ 0.05). spCorr shows the most accurate FDR control, whereas all other methods exceed the target FDR threshold. (D) Statistical power of the four methods under the actual FDR = 0.05 cutoff. spCorr achieves the highest power. (E) ROC curves and corresponding AUROC values for the four methods. spCorr attains the highest AUROC among all methods. (F) The accuracy of the local correlation estimation based on cosine similarity. spCorr achieves a higher score compared to scHOT. (G) Runtime (in seconds per gene pair) versus the number of spots. spCorr demonstrates substantially better computational scalability than scHOT and SpatialCorr.