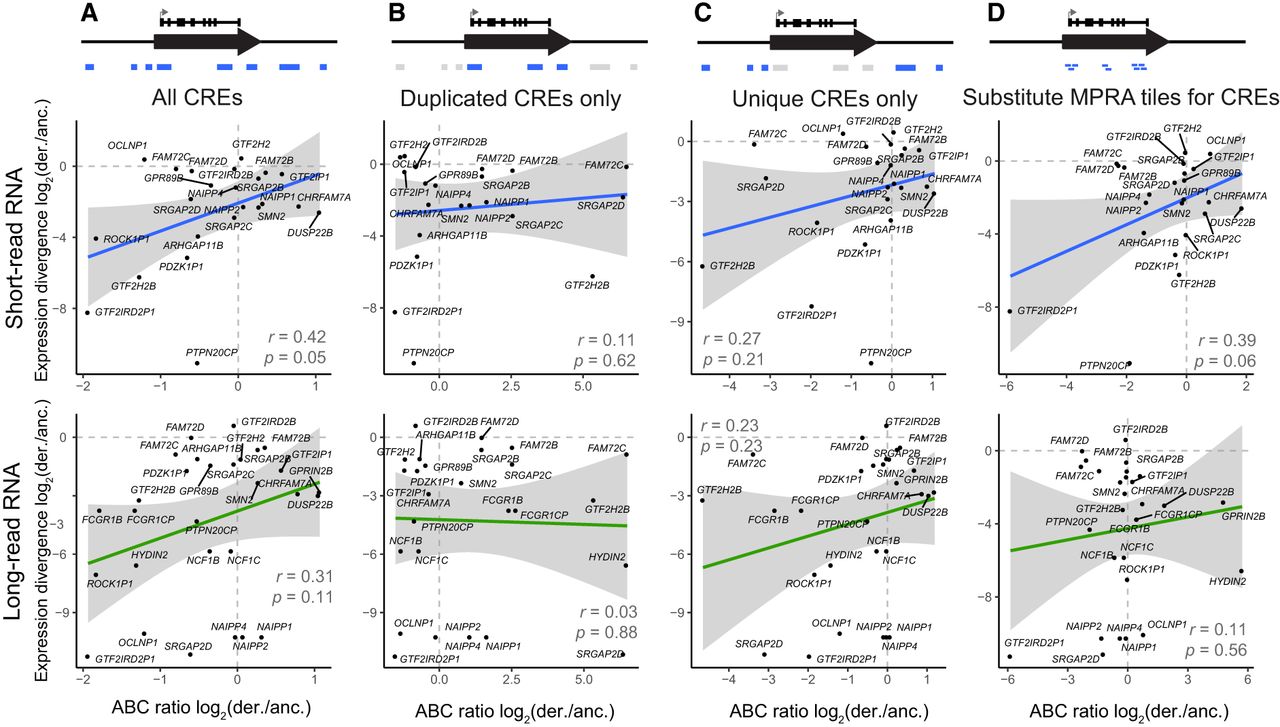
Figure 5.
Comparison of SH-SY5Y expression divergence to predictions from epigenomic data. For each derived–ancestral (der./anc.) gene pair, expression divergence was correlated to the ratio of summed ABC scores calculated from multimapped ATAC-seq and H3K27ac ChIP-seq. The comparison was performed on the following sets of regions: all CREs within 5 Mb, as defined by our ChIP-seq analysis (A); CREs within HSDs (B); CREs outside of HSDs (C); or the exact positions tested by MPRA (D). Pearson's correlation and significance of the linear relationship is printed on each plot, and the 95% confidence interval for the regression is shaded in gray.