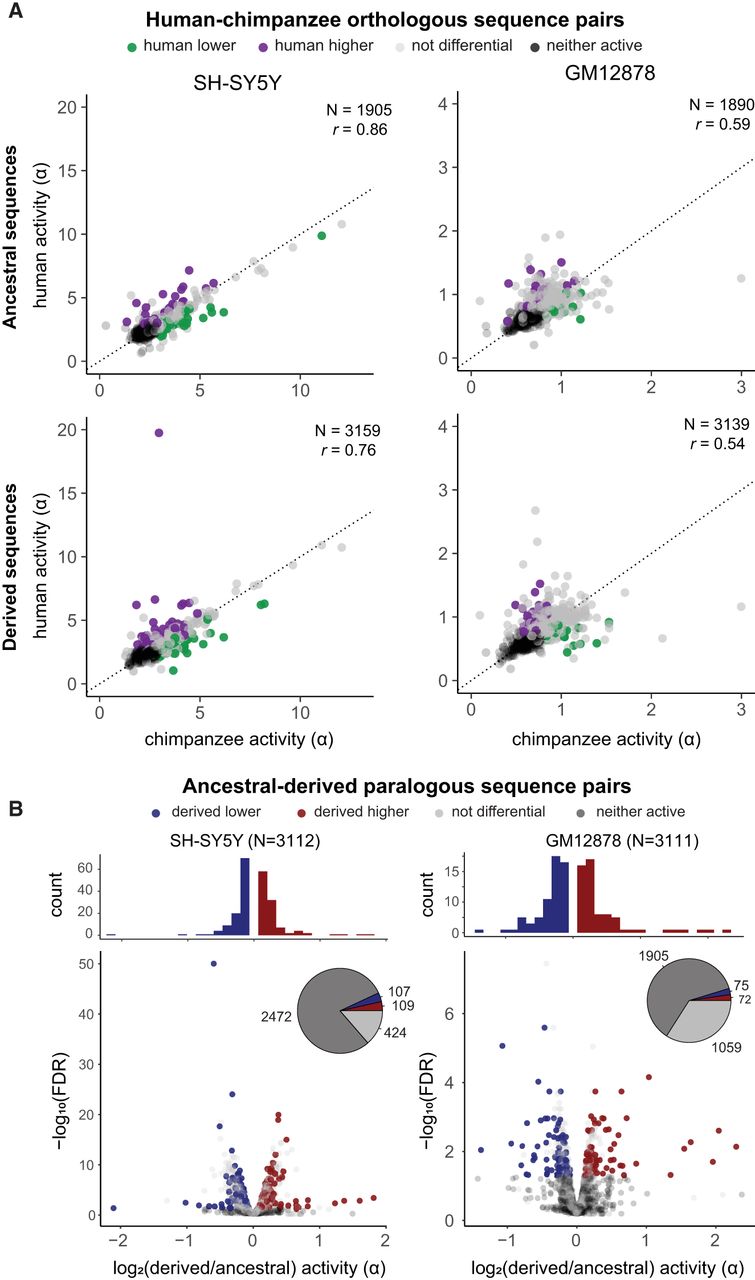
Differential activity between homologous sequences. (A) Scatterplots depict the activity of human and orthologous chimpanzee sequences, partitioned by human evolutionary status (ancestral above, derived below). Each sequence pair is colored by differential activity relative to chimpanzee: green (human lower), purple (human higher), gray (not differential), black (neither sequence active). The dotted line marks the identity y = x, and Pearson's correlation coefficient is printed on each plot. (B) Volcano plots depict differential activity between paralogous human sequences, with each unique derived–ancestral pair plotted separately. Points are colored by differential activity relative to the ancestral human paralog: blue (derived lower), red (derived higher), gray (not differential), and black (neither sequence active). The marginal histograms depict the distribution of log-fold differences for differentially active sequences.